Author: Daniels IT (Page 2 of 4)

Neutrality on reviews of Airbnb and Couchsurfing may not have a neutral meaning

Evaluative comments, also known as reviews, are crucial for the sharing economy systems, such as Airbnb, and Couchsurfing. We reveal by studying reviews in different systems of the hosting segment that there is a considerable imbalance towards more positive reviews in the sharing economy systems. We discuss possible implications for this fact, with the help of an experiment performed with volunteers. We also discuss how to explore the results obtained to develop new mechanisms to help users’ decision-making.

Sharing economy is a term that represents person-to-person activities to obtain, provide, or share access to goods and services, coordinated by online services based on a community of users [See The Sharing Economy].

For example, in the hosting segment, Airbnb is a service that connects people who have a space to share with people who are looking for a place to stay, and the host stipulates the value of hosting. Couchsurfing allows people to share their areas similar to Airbnb; however, the hosts do not charge for the service provided. These services usually compete with hotels, being representatives of the traditional economy. Booking.com is one of the most famous platforms in this category.

Users on the sharing economy platforms are typically invited to express their opinions about the service being used, and reviews are among the most critical types. These opinions are crucial to many platforms in this segment. It is not uncommon for businesses like Uber, another example in the transportation segment, to require drivers to have a particular feedback rating to be kept in the system. In the hosting context, negative reviews about hosts can impact rental decision-making.

An essential element of several businesses of the sharing economy, including hosting services, is the personal contact between the guest and the host. This personal contact, intense or less intense, may favor creating a relationship between guest and host. The same situation is not common in hosting services of the traditional economy. We believe this personal contact may put guests in a difficult spot to provide a negative review in services of the sharing economy. Of course, other factors might also play a role in excessively positive reviews. For example, the bidirectional rating systems, i.e., hosts rate guests, and vice-versa, which are common mechanisms in the sharing economy systems and not so common in systems of the traditional economy. Independently of the reason, if this phenomenon tends to happen more on services of the sharing economy, it could undermine an adequate assessment of the service consumed.

With that in mind, we focused on answering a fundamental question: Do reviews in hosting services tend to be less negative in the sharing economy? 

To conduct this study, we collected reviews from two sharing economy platforms, Airbnb and Couchsurfing, and a representative of the traditional economy, Booking.com. We consider accommodations offered in three Brazilian cities and three cities in the United States. After getting these data, we performed sentiment analysis on the shared texts. We found that reviews in the sharing economy tend to be more positive than those in the traditional economy. This result is illustrated in the figure below, which shows the distribution of sentiments for all platforms, considering all cities studied separately. Note that this result is consistent for all cities. For more information about all technical details, please refer to the original paper that this post is based on (see it here).

Distribution of sentiment for all platforms, considering all cities studied separately.
Distribution of sentiment for all platforms, considering all cities studied separately. Negative (-1 to -4), Neutral (0), Positive (+1 to +4).

We also present some key features of these comments and made several supplementary analyses (all presented here), reinforcing the insights observed. For example, we investigate the topics most addressed by users in negative comments. We focus on negative comments because we hypothesize that, in addition to rarer, they tend not to be very informative on hosting platforms of sharing economy. We identified ten topics for negative reviews on Airbnb and Booking. The table below presents ten words that best describe each topic. We note that all topics for Booking tend to be negative. For example, Topic 2 is related to complaints regarding the room, and Topic 4 is more related to the staff. However, when analyzing the topics for Airbnb, we can identify several topics that suggest positive mentions, all marked in bold and with “**” in the table. For example, Topic 4 suggests being related to the accommodation in general, where the topic indicates that users have approved the stay. For reviews in Portuguese, the patterns are very similar. This means that despite the final negative score of some comments (potentially less intense), they have positive mentions in the evaluation.

Ten latent topics from negative comments written in Engligh shared on Bookingand Airbnb.
Ten latent topics from negative comments written in English shared on Booking and Airbnb. Word stem is being presented.

This phenomenon of more positive reviews on the sharing economy systems may limit users’ perception of the quality of a particular accomofation. As negative evaluations tend to be more scarce in reviews in the sharing economy, neutral opinions can become more critical. It is as if the polarity scale began near the neutral, representing the most negative opinions expressed by the users. This suggests that neutral evaluations should be taken into account at the time of choosing accommodation. These evaluations might make a difference in classification and decision making when selecting a place to stay.

To better understand our results’ implications, we performed a study with volunteers to evaluate how the observed phenomenon affects the user decision-making process. After that, we found evidence that the classification of establishments at Airbnb made by users could be affected due to the lack of negative evaluations.

Our findings suggest that reviews on different platforms might require different interpretations, especially for algorithmic-based decision-making approaches that use reviews in the learning phase. In this regard, our study still discusses how to explore the results to choose better accommodations in the sharing economy. We show how the proposition of simple new metrics that consider the reviews’ sentiment could help to minimize problems that can emerge from the uncovered phenomenon.

We hope our quantitative analysis and observations inspire new approaches to account for this perceived bias towards positivity in hosting platforms.

For more details, see our full paper, “Neutrality May Matter: Sentiment Analysis in Reviews of Airbnb, Booking, and Couchsurfing in Brazil and USA“.
Public/Private Thresholds

line

Population formetics and the circulation of urban forms

This research project looks deeper into the evolution of threshold spaces in the built environment to help us understand the forces that contribute to their adaptation and reproduction in cities. Fueled by the current resurgence in both cultural value and range of activities afforded by them, these spaces reflect shifts in how the built environment enhances or diminishes levels of human interaction. When thinking of public/private thresholds, the word “porch” might come to mind first. Indeed, where privacy is thought of as the domestic, literature on these liminal spaces is dominated by the typology of the porch. Still, people are describing time spent not only on their porches, but on their verandas, galleries, and balconies. Perry (1985) argues that the porch extends the sphere of control from the house into the public arena, while at the same time bounding the public space. More than the mere boundary between public and private, this project’s goal is to uncover the spatial and social differences in the diverse typologies through their evolution. As a work-in-progress, this post outlines some preliminary findings from the project and opens the door to feedback, advice, or any questions sparked by the content.

In Porches of North America (2012) by Thomas Durant Visser, an important resource for this research, the author defines the porch in “the broad contemporary meaning of an identifiable building feature that is open on at least one side or serves as a covered entry and is large enough to shelter at least one person” (p. vii). However, this broad description has also been used for verandas, galleries and piazzas. There isn’t a clear consensus among existing literature on what the exact differences are, as the terms often bleed into each other. These terms have historically been used interchangeably depending on geographic location or social status, rather than describing a morphological difference. For example, “gallery” was most often used in gulf states and French settled regions of Canada (Visser, 2012; Kahn & Meagher, 1990). Further, some scholars claim that the terms gallery, veranda, and piazza were only used to signal a higher social status to the porch, rather than pointing to a spatial difference (Kahn & Meagher, 1990).

Domestic and Non-Domestic Threshold Typologies
Domestic Additions and Special Use Typologies

As a starting point in detangling the evolution of these terms and typologies, Appendix A classifies these threshold spaces by distilling them into a short description based on their historical use or origin and schematic plan drawing, largely based on Davida Rochlin’s 1976 thesis on the American porch. This series focuses solely on front-facing thresholds, excluding those that faced inner courtyards (such as loggias) or away from the public street, such as back decks and terraces. Rather than organizing by time, the study separates domestic from other non-domestic typologies, as research shows that these liminal spaces had their origins outside of the home. For instance, the Hourd, a medieval scaffolding device used for battle, is considered a potential precursor to the cantilevered balcony. The domestic typologies can also be further separated into spaces created through addition, such as enclosed porches or cloth awnings. Notably absent in this first series is the word “porch” by itself, due to the difficulty in distilling into one defined drawing or definition as previously described above.

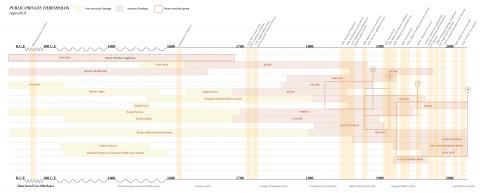
Appendix B is a timeline diagram that studies when the previously noted typologies emerged, when they rose in popularity, and potential lineages between them. It is notable how their prevalence was mostly concentrated between the early 19th century to early 20th century. Where there are American and non-American typologies directly following each other, there is a suggested lineage, such as the French galleries and the American gallery. In addition, it is evident in this diagram how little is known of the potential lineage from indigenous and afro-Caribbean typologies. While most pattern books refer solely to European precedents (Downing, 1852) some southern American scholars claim that the front porch was imported through European settlers of Caribbean islands, due to climatic similarities (Perry, 1985; Donlon, 1996).

Typology and Styles Timeline

Along the top of the diagram are important events that marked a change in use or prominence; here we see the effect of the introduction of pattern books resulting in general diffusion of the form, but also that of war and the introduction of new technologies such as the automobile and air conditioning, resulting in an increase in privacy around the 1940’s (Visser, 2012; Wilson-Doenges, 2001). Enclosed and screened porches increased in popularity; layers added on to make them more of a secluded transition space rather than outdoor living spaces. However, even the “transition” quality of them is questionable. Perry (1985) makes a claim that glassed-in enclosures erase the quasi-public nature of the threshold, rather extending the private sphere of the house. By 1990, car garages were a widespread feature of most new houses being built, taking over a large part of the front facade where porches once were. In this way, the garage became the main access to public space, effectively disrupting the threshold at the porch where these worlds overlap. People retreated to the back deck (or more recently, the internet and social media) for social gatherings, preferring a life separated from the noisy and dirty street.

Appendix B also started classifying popular housing styles that were recognized by their porch as a defining feature. In North America, we tend to associate Victorian houses with large threshold spaces, for example. Here we can see a “call out” of four style groups, expanded on in Appendix C, which starts to match popular styles with typologies or words used in association with that style (whether through drawings or written word). The styles were defined by these typologies, but not vice versa. For example, style group 2 encompasses a wide range of terms, despite its short time period. In Appendix C, we see this group is associated with the Queen Anne style. Considering the sense of security and comfort associated with threshold spaces during this period (Visser, 2012),  the variety of typologies employed in Queen Anne homes reinforces a linkage between the accumulation of terms and their affordance of opportunities for social engagement.

Mapping connections between popular housing styles and typologies

Though most of existing literature claims an approximately 100 year time period when porches were most popular, we are seeing a comeback in the past few months due to the COVID-19 pandemic lockdown. The term ”porch sitting” was popular in both that time period and today, as it is now considered one of the safest ways to connect with the public. One of the findings from Appendix B is that an increase in popularity corresponds with the increased use of these spaces as community network building, rather than for climate control. On a larger scale, the affordances fluctuate between more social activities and storage/climate control, as seen at the bottom of the diagram. Appendix D looks deeper into this accumulation of affordances throughout time. Further research is needed to describe the discarding of affordances, as the diagram shows a time when these activities were popular but not whether they persisted. It is interesting to note the evolution of these spaces as mediators between sacred spaces to mediators between public/private spaces – has privacy become sacred?

Accumulation of Affordances over Time

The two last studies, Appendix E and F, look into house plans found in popular pattern books and kit homes, mostly during the time they were most popular up to the 1970’s when the back deck really took over and words like “concrete slab” started replacing the front porch. Click here and here to look closer at the plan analysis. The typologies are highlighted in these plans and color coded for an approximate comparison of size and location. As a general trend in the mid-19th century, verandas were larger and more rectangular in shape, at least 12’ deep and 14’ long. Porches were also included in the plan, but these tended to be smaller areas right where the door was, making them more square in shape and generally not wider than 8’. These findings are consistent with some descriptions found in literature where the authors attempt to clarify subtle differences in typologies (Visser, 2012). In the early 1900’s, porches became larger, taking the place of verandas. This corresponds to the rise of the “leisure class” (Kahn & Meagher, 1990) and the advent of electrical lighting, allowing verandas, or porches, to become deeper. By the end of WWII, these spaces diminished in size, if included in house plans at all. An important finding from this study is the gradual consolidation around the word “porch”, as represented by pink in the diagram. This is best observed in Appendix F, showing a “figure ground” drawing series of the plans analyzed.

The size of thresholds have a linear relationship with the accumulation of affordances. Smaller porch designs from factors described above resulted in less activities taking place on them, thereby reducing their importance in people’s conception of the home, contributing to its continuing decline. This is consistent with Wilson-Doenges’ (2001) research of factors that increase or decrease front porch use in a post 1970’s neighborhood in the United States. This study found that other than pull factors that lead to lifestyles no longer supporting front porch use, small “cartoon” porches where activities are limited is a push factor that reduces porch use.

Popular Plans from Pattern Books and Kit Homes Analysis

It is important to note the limitations and biases in the studies performed for this project, notably in the timeline and plan study (Appendix B and E). For instance, the plan study does not consider regional preferences for the terms, as these plans might have been published in parts of the continent where they speak differently. Further, it is mostly concentrated on those published in the United States, marking a bias away from Canada. Frequency of terms or typologies found in these plans are not reflected, as porches were included less often after 1920. However, rather than it being an exhaustive survey of the frequency of a certain typology or exact timeline of its existence, these studies suggest both a general shift in the size and use of them, and a general resurgence of it with respect to the gaining/loss of a certain affordance. Moreover, it suggests a direction of research we could take with machine learning.

Moving forward in this project, in addition to refining and continuing the studies performed, there are a few questions and possible avenues to explore:

  • What exactly caused the word “porch” to absorb the wide range of terms and typologies previously used for front facing thresholds?
  • Further research into balconies as an important threshold typology. What does it mean when the boundary is not physically accessible to the street, while still visually accessible? This is especially important today as it has seen an increase in affordances attributed to these spaces (food basket delivery in Italy, concerts, exercise).
  • Does the linear relationship between affordances and size still hold true today? Is the dimension of threshold spaces more a matter of “social distancing”?
  • In the study of the plans, one observation was that the “word” porch was also used over the years to describe the side and back outside features. Why did that stop being used, and why did the “back porch” change to “back deck”? Is it simply a manner of taking off the roof?
  • Further research into the evolution of a specific typology through a derailed study of how they were represented in plans over the years.
  • Further research into using Google street map view. A preliminary study was done on this, finding it hard to observe a difference over the years shown other than updating the style of the porch. It seems most of the major changes to front facing thresholds occurred before 2007, when GSM was not yet available in Toronto.
  • “Push” and “pull” factors (such as Wilson-Doenges 2001 work) from porch use during the Covid-19 pandemic.
  • Looking in more detail at a specific lineage as suggested in Appendix B. What are the formal linkages between the typologies, and how did that affect the affordances available through time?
  • Translate main findings from this report into UGP’s formal evolutionary model

New article published: The Spatial Articulation of Urban Political Cleavages

line

Cities as ecological niches

A central question in the Urban Genome Project concerns the processes by which features of urban life reproduce themselves over time according to characteristic spatial patterns. One of the surprisingly enduring features of many cities is their characteristic political order: political alliances and oppositions expressed in their geographies.

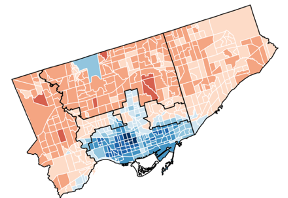
Our recently published study, “The spatial articulation of urban political cleavages,” examines the bases of this recurrent order, using Toronto, London (UK), and Chicago as case studies. We  investigate how a certain activity — mayoral voting — varies depending on the concentration of groups, the built environment, and its spatial location. In the context of our general theory of urban evolution, this can be viewed as an effort to identify the extent to which the recurrent patterns of political activity in these cities derive from variations in their underlying genomes and the emergence of ecological niches in which those activities tend to thrive.

The abstract is below, and a more detailed summary with key figures and results may be found here.

Synthesizing and extending multiple literatures, this article develops a new approach for exploring the spatial articulation of urban political cleavages. We pursue three questions: (1) To what extent does electoral conflict materialize between rather than within neighborhoods? (2) How salient are group, place, and location in defining urban cleavages? (3) How do these sources inflect one another? To answer these questions, the article analyzes a novel longitudinal database of neighborhood-scale mayoral voting in Chicago, Toronto, and London. We find strong evidence of spatially articulated cleavages: in each city, voting patterns are equally or more geographically concentrated than the non-White population, income, and poverty. While group-based interests define Chicago’s cleavage structure, place and location are paramount in Toronto and London. We conclude by proposing a research agenda for investigating the spatiality of urban politics and advancing a preliminary typology of urban political cleavages and the conditions under which they may arise.

Exploring LA’s Restaurant Niches

LA’s Mexican and Chinese Restaurant Niches

A niche, as Popielarz and Neal say in their 2007 article is a set of environmental conditions under which a species thrives. As part of the Urban Genome Project, we are searching for the characteristics of ‘niches’ that allow for urban forms to reproduce, and how these characteristics may have changed over time. Here, we demonstrate our approach by applying the niche concept to Los Angeles’ restaurant scene. Stay tuned for more detailed studies. 

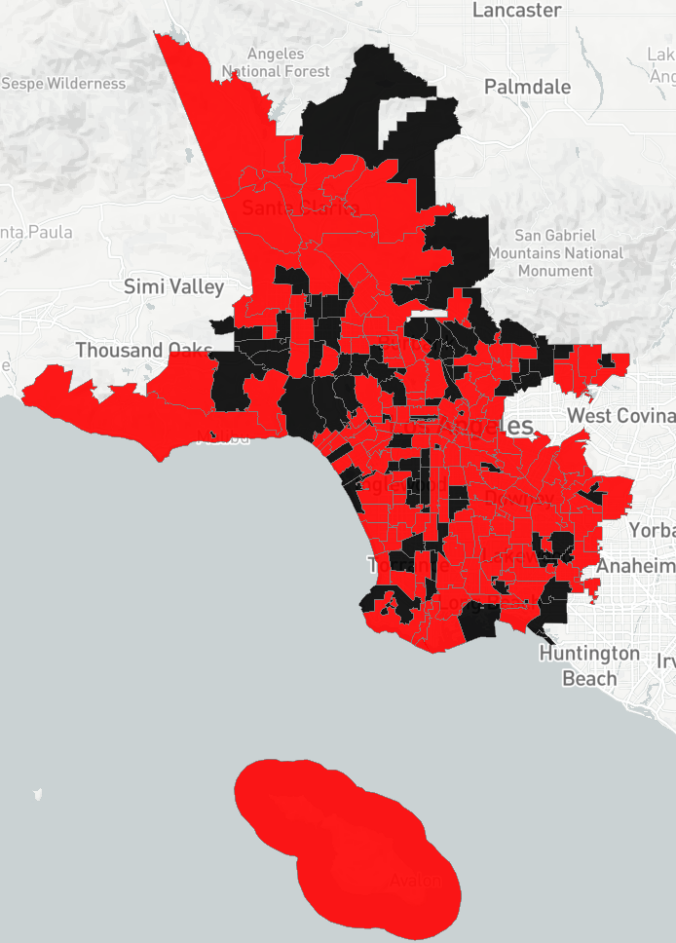
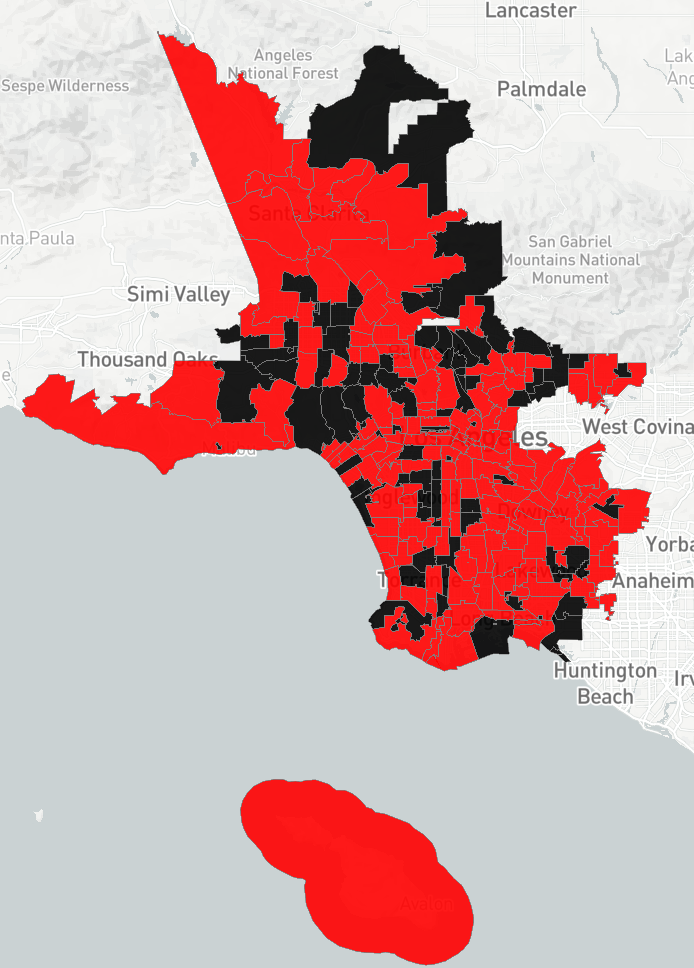
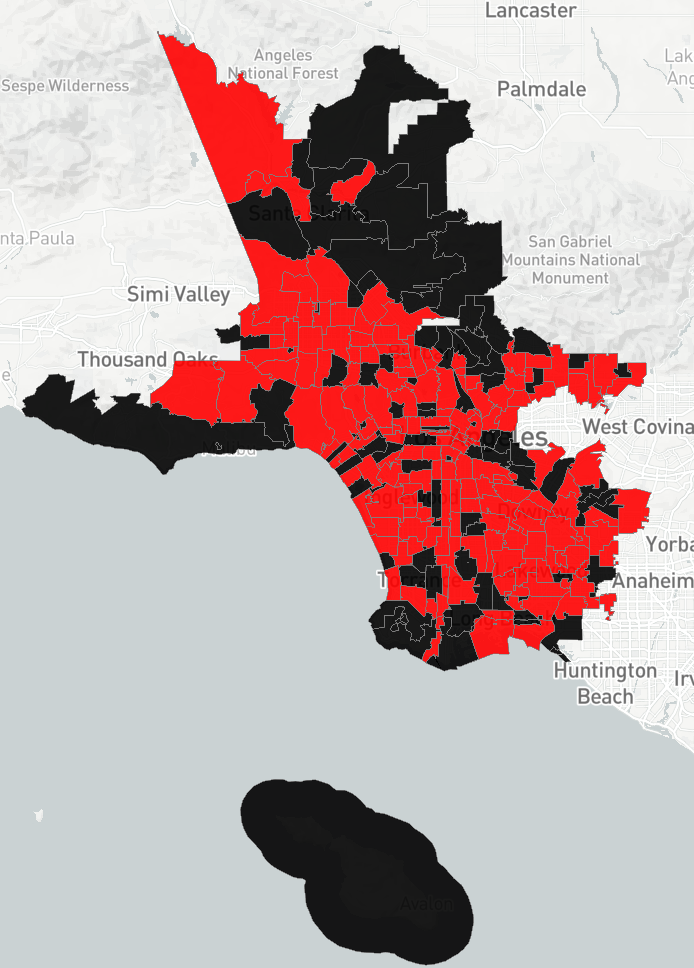
These maps show the neighborhoods with and without Mexcian and Chinese Restaurants. Red-shaded zip codes have restaurants of a certain type, dark ones do not. Given the abundance of these restaurants forms in LA as a whole, it’s reasonable to conclude that most black-shaded areas do not have the conditions required to sustain a certain restaurant species. 

Data for the maps comes from recent Yellow Pages directories, generously shared with us by the “friendly cities lab”. It may not be fully representative of all restaurants but there’s no reason to believe that it is biased.


According to this data:

  • Nearly half of all zip codes with restaurants have both Chinese and Mexican restaurants, 19% just have Mexican restaurants and  17% just have Chinese.
  • There is only a loose correlation betweeen the number of Chinese and Mexican restaurants in a zip code(r=.16)
  • 56% of ‘Chinese-Only’ niches are in LA City but only 32% of Mexican Only ones are.
  • Long Beach, East Los Angeles, and Santa Clarita stand out as cities with more Chinese restaurant deserts; Glendale stands out as a city with more Chinese Restaurant Deserts.  

You can explore the trends with the maps pasted below, or at the app here.

Mexican Restaurant Niches

Map by Fabio Dias

Chinese Restaurant Niches

Map by Fabio Dias

Piccard: Workshop material and cross city comparison

line

Mapping the evolution of cities

The project workshop on Nov 2, 2018 includes a presentation about Piccard and related efforts to understand urban data.

The presentation can be found here .

Related internal resources:

Transformation and Annotation of Crowd-Sourced open data into the Global Urban Data Repository

The increasing urbanization and rising need for sustainable development demand effective urban planning, infrastructure development and upgrades. This is a difficult problem due to fiscal limitations and dynamic nature of cities. A novel approach to address this issue is through urban informatics, which uses urban-related data, with aids from mathematical tools and computer science, to better understand urban systems and make economic decisions. Recognizing the importance of urban informatics, an immediate question to ask is how to discover, organize and make openly available urban datasets, which would remain hidden in the nooks and crannies of the Internet. With the research problem in mind, we propose the Global Urban Data Repository (GUDR), a crowd-sourced open repository of urban data build on the standards of the Semantic Web.

Dynamic models of urban segregation

Teaser

Description

Thomas Schelling’s classic paper is a key reference point for agent-based models of segregation.  It is often taken as providing fundamental insight into the micro-processes that produce the segregated macro-structures that characterize urban settlement patterns.   In this research tradition, however, urban form plays a very limited role, despite the fact that Schelling himself introduced his model by reference to venues (such as churches) and spatial areas (such as neighbourhoods).   Form is generally reduced to an agent’s capacity to ‘see’ nearby grid-cells of the simulation world: an agent’s neighbourhood is its Moore neighbourhood.

In this research, we argue that an analytically meaningful simulation of neighbourhood formation – or more specifically of integration and segregation dynamics – must acknowledge the role of built form. We introduce a model of physical venues into the classic Schelling model in order to reconsider the simulation’s dynamics as influenced by both the spaces where agents live and the spaces of their activities. Venues structure the urban environment because i) they are foci of interaction and ii) their number and physical distribution constrains agents’ behaviour.  Articulating and observing the consequences of some simple rules for the interaction between agents and venues, we are able to generate characteristic combinations of integration and segregation that have distinctive urban features lacking in typical Schelling-type models.  Moreover, whereas in Schelling-inspired formulations, once a pattern of segregation congeals it is nearly impossible to change, we show that under some circumstances shifting the location of venues may break or redefine underlying patterns to some degree.

In a series of four case studies of increasing sophistication, we observe novel combinations of integration and segregation, brought about by the interaction between agents and venues. In our first study (1), we investigate different spatial configurations of venues from simple geometric distributions to a core and periphery model. Findings highlight the more realistic settlement patterns emerging from the interplay of a planned configuration of venues and the self-organizing behaviour of agents. In our second study (2), we consider variations in a venue’s exclusivity – the extent to which venues of a given group are open to admitting members of other groups. We discuss the parameters under which a range of outcomes result, from integration made possible by adjacent and exclusive venues, to ‘co-opting’ that can be caused by highly inclusive venues. In the third study (3), we build on prior experiments in the literature that have examined unequal populations, and demonstrate how majority/minority dynamics are affected by the presence of physical venues. Finally (4), after noting the high stability of segregated outcomes in Schelling-style simulations, we apply our venue model across a range of parameters in order to evaluate conditions under which settled, segregated neighbourhood patterns become disrupted.

In addition to their particular substantive points, a persistent interest of these studies is whether – and under what parameter ranges – access to group-specific venues allows individual agents to be comfortable remaining in a more diverse neighbourhood vs. these same venues becoming attractors that reinforce Schelling dynamics of segregation. In the process of introducing the case studies, we also describe and deploy a series of methodological innovations. For example, we begin each study with a visualization of the variety of simulation outcomes across value ranges of two input parameters (for example “intolerance threshold” vs. “max travel distance”). These representations, which we refer to throughout as parameter spaces of the simulations, organize the discussions of our findings and allow us to emphasize significant steps or thresholds, where small changes in the input parameters yield large changes in the results (Schelling’s classic example of which is the intolerance threshold around 1/3rd). Where necessary, we also introduce specific techniques of visualization and analysis to effectively characterize the movements of agents and the resulting patterns of clustering in relation to the built form of the simulations.

A working draft of the paper is available here.

attachments
Dynamic_Models_of_Urban_Segregation.pdf

Interactive tool for visualizing urban ecology of musical unconventionality is online

line
Cities as ecological niches

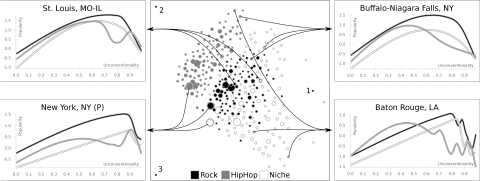
To understand how the relationship between musicians’ unconventionality and popularity varies across cities, we built in interactive visualization tool.  It can be accessed here

The tool allows a user to compare cities in terms of the musicians that are located there.  Across cities, there tends to be an “inverted U” pattern, whereby musicians that are “too conventional” or “too unconventional” are penalized, while bands that exist in the “sweet spot” between the two are relatively popular.  However, the shape of this relationship varies depending on the city.  

The urban ecology of popular music

Teaser

Description

Cities are breeding grounds of distinct modes of cultural activity.  In this study, we examine how popular musicians define themselves differently depending on their location.  In particular, we examine the relationship between bands’ degree of conventionality and unconventionality and their popularity.  We show that this relationship in general exhibits a non-linear, inverted U pattern: extremely conventional bands are relatively unpopular, somewhat unconventional bands show more popularity, while the most unusual bands are not very popular. 

However, this general pattern shifts, across musical genres and geography.   Some cities show greater receptivity to unconventionality, with more unconventional bands achieving greater popularity, while in others more conventional bands tend to thrive.  We examine several features of the urban environment that might explain these variations. We do so using a large database of nearly 3 million band profiles from myspace.com, circa 2007.  

An interactive tool for exploring these relationships can be accessed here

« Older posts Newer posts »