Teaser

Description
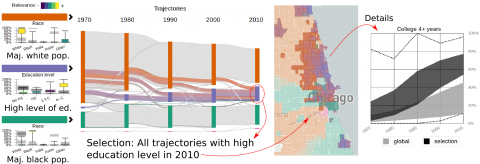
Census measurements provide reliable demographic data going back centuries. However, their analysis is often hampered by the lack of geographical consistency across time. We propose a visual analytics system that enables the exploration of geographically inconsistent data. Our method also includes incremental developments in the representation, clustering, and visual exploration of census data, allowing an easier understanding of the demographic groups present in a city and their evolution over time. We present the feedback of experts in urban sciences and sociology, along with illustrative scenarios in the USA and Canada.

Leave a Reply
You must be logged in to post a comment.