line
Mapping the evolution of cities
Measuring the evolution of cities is challenging. In particular, definitions of spatial units change over time. The standard methodology is to create standardized definitions and interpolate data across years to the same boundaries. A recently published UGP paper proposes a new methodology for studying long-term neighbourhood change that avoids certain pitfalls of this standard approach by completely avoiding the need to harmonize geographies.
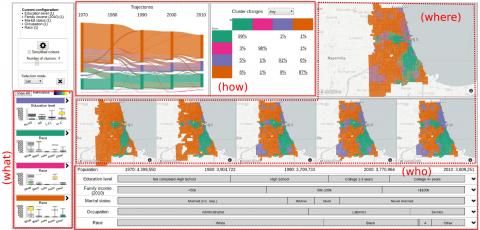
In addition, the paper utilizes a novel interactive visualization tool to present results and provide researchers with opportunities to explore the data further, across some 40 US and Canadian cities.
The paper is published in Geographical Analysis, and can be found here. Here is the abstract:
This article proposes a novel method for data‐driven identification of spatiotemporal homogeneous regions and their dynamics, enabling the exploration of their composition and extents. Using a simple network representation, the method enables temporal regionalization without the need for geographical harmonization. To allow for a transparent corroboration of our method, we use it as a basis for an interactive and intuitive interface for the progressive exploration of the results. The interface guides the user through the original data, enabling both experts and nonexperts to characterize broad patterns of stability and change and identify detailed local processes. The proposed methodology is suitable for any region‐based data, and we validate our method with illustrative scenarios from Chicago and Toronto, with results that match the established literature. The system is publicly available, with demographic data for over forty regions in the USA and Canada between 1970 and 2010.

Leave a Reply
You must be logged in to post a comment.