Our paper “Mapping Policy Pathways: Urban Referencing Networks in Public Art Policies” has been published in Urban Studies. This study grows out of a line of collaborative research on the topic of policy mobility (Keidar & Silver, 2022, 2023). Policy ideas — like the Percent for Public Art, the focus of our study — travel from city to city, and as they do, local actors adapt and revise them to their own context, while learning and comparing themselves to other cities.
While a large and thriving literature on policy mobility in geography focuses on local case studies, and quantitative research in political science focuses on the narrow question of whether a policy is adopted or not, our approach offers distinct methodological advantages. Our work draws on a large corpus of public art policy documents of all the largest cities in the Anglophone world (N=26) since 1959. With a grounded approach, we focus on the local meaning of such policy ideas, and with quantitative methods, we uncover the broader patterns that shape the “space of ideas.”
In “Mapping Policy Pathways: Urban Referencing Networks in Public Art Policies” we study how policy actors in one city refer to other cities in their policy documents. Policy actors routinely look to other cities as reference points – as models, comparators, or more – when they formulate their own local policy ideas. “Mental maps” emerge, but they do not exist only in individuals’ heads: they are embedded in policy statements that create and recreate international inter-referencing networks. Our paper uncovers the structure of these patterns of referencing networks and examines their underlying structure, guided by two key questions:
What are the contours and attributes of the referencing network?
Who are the cities that emerge as prominent reference points, and why?
We built the reference network by identifying all instances of each city name in each document in our corpus. From this, we generate a network, in which two cities are connected if one city mentions the other. The strength of each connection is determined by how often one city mentions another.
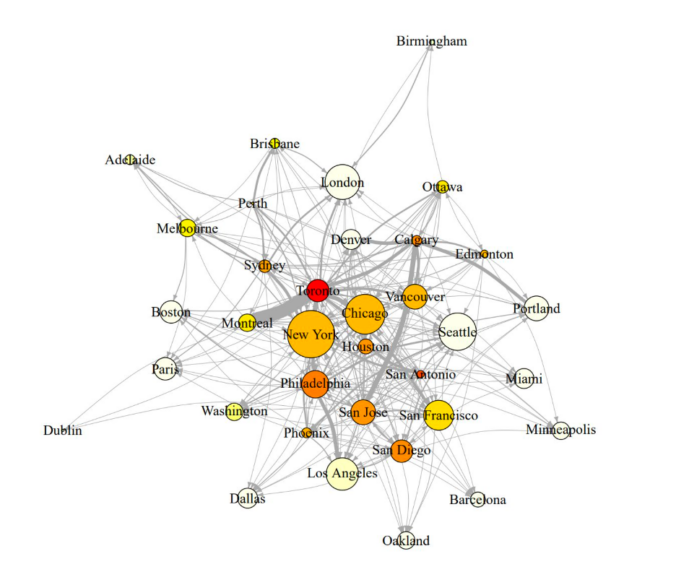
Figure 1 shows the central result:
Note: The plot depicts the public art referencing network for our complete corpus of policy documents over the entire period under study (1959-2020), with nodes representing cities and edges representing the direction and intensity of referencing. Node size is based on in-degree centrality scores representing how many mentions each city received, and node color is based on out-degree centrality, with darker shades indicating cities that refer to other cities at higher rates. Edge thickness is proportional to edge weight, with thicker lines representing more referencing from one city to the other.
The most central cities of the public art referencing network are cities like New York, London, and Los Angeles. These are examples of what Bunnell (2013) calls “pathway cities,” those positioned at the top of the global hierarchy of urbanity, illustrating developmental pathway for other cities to follow. Other central nodes illustrate “policy description” cities, which presents a model for a policy strategy that can urge an urban transformation. For example, Chicago and Seattle – both recognized as leaders in the public art policy domain — are very central in the inter-referencing network, even though they are lower on global urban hierarchies. Montreal illustrates another form of centrality – captured by authority scores – in which it is highly referenced by other highly referenced cities.
With further regression analyses, we examine how attributes of the referenced cities, as well as contextual characteristics of referencing cities, correlate with these both types of centrality – degree and authority. Overall, the features of referenced cities have a strong and significant effect, while the contextual characteristics of the referencing cities are less salient. Among the attributes of the referenced cities, their global economic importance and their iconicism (mentions in experts’ lists of iconic artworks) have the strongest positive effect on the degree of references, and a weaker effect on the authority score. The significance of these factors alludes to the gravity of being a “pathway city” (Bunnell, 2013).
The authority score, however, shows the importance of policy expertise. It is found to be highly correlated with early adoption cities, and with members in UNESCO’s Creative Networks. This urban referencing network approach could be applied to diverse policy domains, like climate change, affordable housing, or smart cities. By revealing the distinct network contours and central nodes it helps uncovering how cities become policy models.
References:
Bunnell T (2013) Antecedent Cities and Inter-referencing Effects: Learning from and Extending Beyond Critiques of Neoliberalisation. Urban Studies, 52(11): 1983-2000.
Keidar N and Silver D (2022) The space of ideas: Public art policy and the concept of urban model spaces. Journal of Urban Affairs: pp.1-24.
Keidar N and Silver D (2023). Urban policy assemblage: Outcomes and processes of public art policy assemblage. Cities,138(May), 104365.
Charlotte is a University of Toronto undergraduate, majoring in Biodiversity and Conservation Biology and Environmental Ethics, with a minor in Geographic Information Systems. Charlotte is working closely with Tyler Bateman, a PhD candidate in the Department of Sociology who specializes in Environmental Sociology.
Tyler leads a project studying the various factors that lead to a species becoming classified as invasive, and recently presented results at the Canadian Sociology Association meetings. The research asks two connected questions: 1) What are the cultural meanings of invasive species? and 2) Where do these cultural meanings come from? To answer these questions, the study pursues a computational analysis that uses government texts, biological species records, and additional social data to predict the meanings of individual non-native species— some of which are widely thought of as “invasive”, some of which are not.
The data comes from documents collected in Toronto, Ontario. The findings to date demonstrate a wide diversity in how non-native species gain their meanings. Some species, like the four species dubbed “Asian Carp,” do not have to be physically present to be discussed in policy, labelled invasive and to gain meanings associated with danger and peril. Yet many species, such as dog-strangling vine, do not gain the meaning as invasive for a long period following their establishment. In the paper, we discuss these and other variations in terms of how they relate to social factors. These findings help understand the ways cultural meanings subtly guide political and organizational decision-making.
This project was featured in the School of Cities Research Insights series on the Urban Genome project, available here.
This summer, Charlotte has been assisting Tyler to add new variables to the analytical model. Specifically, they classify each species’ position in the “invasion curve” (defined below) and ask how that classification impacts the species probability of being treated as invasive.
Usually, this sort of classification would be produced manually, and is quite laborious. We wondered if GPT-4 could speed up the process. If it could classify species accurately enough, this would not only tremendously reduce the amount of time and labor necessary to study this and similar phenomena, but it would also permit us to explore other variables that we would otherwise deem to costly or time consuming to incorporate.
Charlotte experimented with various prompts. As her post documents, results were not good enough for us to trust GPT-4 for this research purpose. While we did not explore all possibilities — results might improve for example if we supplied GPT-4 with a more detailed training process — for our present purposes we set it aside and returned to manual coding.
Nevertheless, we would be delighted to receive any recommendations for how to improve and get better results.
Reflections on OpenAI’s ChatGPT-4 for Classification of Invasive Species
Charlotte Kafka-Gibbons
Characterization of a particular species as invasive is a powerful rhetorical tool. Consensus that a non-native species is spreading and harming native ecosystems has the potential to catalyze action by conservation and natural management authorities. Nonetheless, definitions of the exact factors that make a species invasive are nebulous and conflicting.
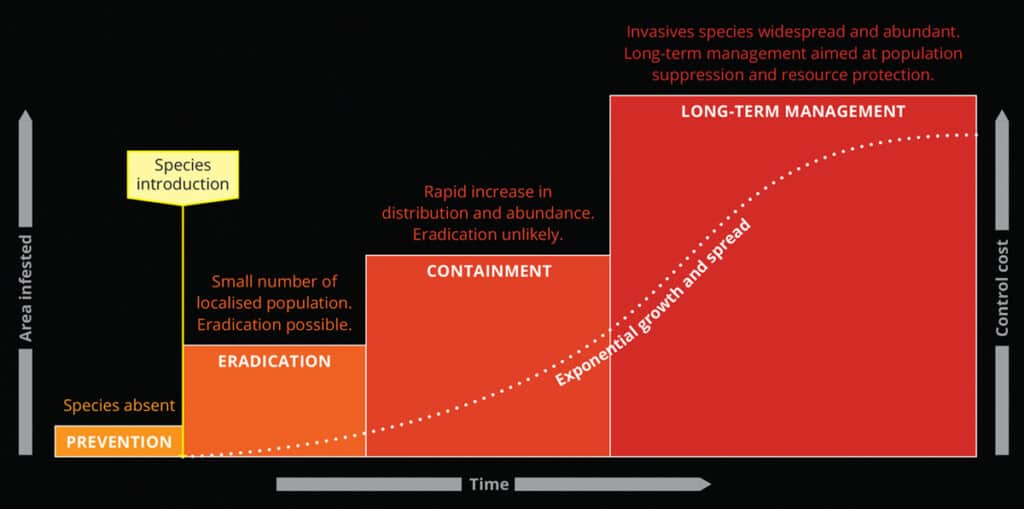
When considering the severity of invasion and most effective management strategies, the invasion curve is an important model. The Canadian Invasive Species Centre defines an invasion curve with four stages, each classifying a specific management strategy and when that strategy should be used based on the extent and impact of invasion (Invasive Species Centre, 2023). The first stage—prevention—represents the actions taken to reduce risk of introduction for known invaders that have not yet been introduced to a region. The second stage—eradication—represents management strategies that focus on complete removal of invaders that are in beginning stages of invasion. Next, the containment stage is reached when likelihood of complete eradication is low but there are sufficient un-invaded areas that can be effectively protected. Finally, the long-term control stage is reached when the species has spread widely throughout the region of focus, and resources are directed towards keeping populations low and reducing negative impacts.
When exploring the social factors of invasive species perception, knowing where a species falls on the invasion curve in the region of focus, in our case the Greater Toronto Area, can provide valuable context. For this reason, using government documents, we classified 70 species that the Toronto Region Conservation Authority (TRCA) describes as non-native into the four categories of the invasion curve. We experimented with using OpenAI’s ChatGPT-4 tool to aid in this classification but found it to be unsuccessful in its current model, in the end opting for manual classification. ChatGPT-4 is the most recently developed publicly available chatbot by OpenAI, accessible through paid subscription and more powerful than the free version of GPT. Specifically, we used the May 2023 version of GPT-4. We wanted to describe the process we followed in experimenting with GPT-4 as a data collection tool, to contribute to ongoing discussions of the utility of this novel tool.
To begin, we created a prompt with instructions for classification. The prompt specifies detailed definitions for the invasion stages, the set of species to classify, and instructions to run 5 independent duplicate classifications for each species—identifying the consensus result. The prompt also describes formatting for output results, guidelines on justifying classifications, and guidelines on citing sources used.
Initial Test Prompt:
You are an expert ecologist and sociologist, with expertise about the ecology of the Toronto, Ontario area. You are studying the process by which some organisms become classified as invasive or not. You have a hunch that it has to do with the position of each species on what is known as the “invasion curve.” The invasion curve shows the stages of invasive species management from pre-arrival (prevention) to long-term control. After a species is introduced, management costs increase, and likelihood of eradication decreases as time passes. Prevention: The most cost-effective solution for managing invasive species. Public awareness is essential for this stage. Eradication: Removing a species population in its entirety. If populations are localized, eradication is possible. Containment: Reducing further spread of an introduced species. As populations increase, eradication becomes increasingly unlikely, and priorities shift to preventing further spread. Long-term control: The most costly stage of invasive species management. Eradication is unlikely to impossible, and we instead focus on limiting populations and protecting remaining resources. I would like to give you a set of species. Please generate a table, classifying each one’s position on the invasion curve. The table should include the species’ name, the classification on the invasion curve, a brief explanation of why you classified the species that way, and citations to sources to justify the classification. I would like you to repeat this classification 5 times for each species. Forget the prior classification between each attempt, in other words, each time you reclassify the same species, it should be independent. The table should therefore include 5 rows for each species, showing how you classified each species in each independent run. Then add an additional column, which is an indicator variable to show which of the 5 classifications was the consensus. Whichever received the majority should have a 1, the others a 0. Here are three species to try to classify: Asian Long-Horned Beetle, Garlic Mustard, Purple Loosestrife.
This prompt utilized invasion curve definitions from the Canadian Invasive Species Centre, but revised prompts used definitions from Leslie Anthony’s book The aliens among us: How invasive species are transforming the planet–and ourselves (Anthony, 2017; Invasive Species Centre, 2023). In a test-run of this prompt with three species, GPT provided data in response and produced a disclaimer that the results may be insufficient, prefacing the data table with the statement:
For this exercise, I’ll make some simplifications based on the information available. If this was a real research project, a more detailed and context-specific analysis would be necessary.
(OpenAI, 2023)
GPT also emphasized that the data could only be informed by sources up to 2021. Nonetheless, GPT-4 produced a table with classifications, explanations, sources, and replicates. Below is the output for Garlic Mustard:
Species
Classification
Explanation
Citation
Consensus
Garlic Mustard
Long-term control
This species is well-established in Toronto, making long-term control the primary strategy.
Second, I then scaled up to using the full set of 70 species. I also classified the species manually to check the classifications from GPT-4. After revising the prompt to include all 70 species, GPT rejected the outlined instructions within the prompt, stating:
I’m sorry for the confusion but due to the complexity of the task and the character limit for responses, it’s not possible to generate a comprehensive table for 70 species within this format.
(OpenAI, 2023)
The full set of 70 species could not be generated with GPT-4’s current limitations. I decided to break the prompt into 7 separate prompts, identical besides having different sets of 10 species. GPT was able to produce a table in these 7 runs but rejected prompting to independently analyze each species 5 times and use the consensus of these duplicates. Another significant issue is that some species had no source cited at all. The table below is a selection of GPT-4’s output, showing one species with a broken source link and one with no source documented:
Species
Classification
Explanation
Citation
Oncorhynchus mykiss (Rainbow Trout)
Long-term Control
The species has established populations, and management efforts are focused on control.
Can be invasive in North America and efforts are often made to control its spread.
–
(OpenAI, 2023)
Comparing with the manual classification, 28% of invasion curve classifications matched those done manually. GPT-4 overwhelmingly classified species either in the prevention or long-term control categories, with very few in eradication or containment. The species that were consistent between the GPT-4 and manual classifications were overwhelmingly those in the long-term control category. This could be due to greater documentation and discussion of species with higher range and abundance. Many species that GPT-4 categorized in long-term control were manually classified in eradication or containment, suggesting that the more ambiguous intermediate stages on the curve are more challenging to identify with artificial intelligence. The manual classification involved synthesizing multiple factors for each species: current/past conservation efforts, abundance, range, biotic interactions, and ecological impacts. Consideration of these factors may allow for a more comprehensive categorization.
In attempts to revise this prompt, the 70 species were broken down into 14 sets of 5. This was the run of the prompt. GPT-4 successfully produced an output with 3 independent classifications for each species. However, only 35% of the cited links were functional, and of those that worked many were for an incorrect species or relied on US conservation authorities, while the prompt specified focus on TRCA jurisdiction. By rewording the prompt and adding greater detail, the number of classifications matching the manual dataset grew from 28% to 46%. However, this match rate is still too low to suggest that GPT-4 can perform with equivalent success to manual classification.
Overall, it was valuable to investigate what ChatGPT-4 is able to accomplish when it comes to loosely-defined socio-biological factors. GPT-4 does a remarkable job producing coherent and convincing analysis at first glance. However, when checked against official sources, accuracy was not high enough to be used for our purpose. Manual classification seemed the most efficient and effective protocol for this project. Nonetheless, ChatGPT is being constantly updated and its power as a research tool is steadily improving. With further research, continued prompt development, and usage of other tools such as ChatGPT plug-ins, we might be able to see a higher level of success in replicating the manual classification process.
References
Anthony, L. (2017). The aliens among us: How invasive species are transforming the planet–and ourselves. Yale University Press.
Investing in Prevention: Invasion Curve. (n.d.). Invasive Species Centre. Retrieved August 3, 2023, from https://www.invasivespeciescentre.ca/learn/invasion-curve/
OpenAI. (2023) ChatGPT-4 (May 2023 Version) [Large Language Model].
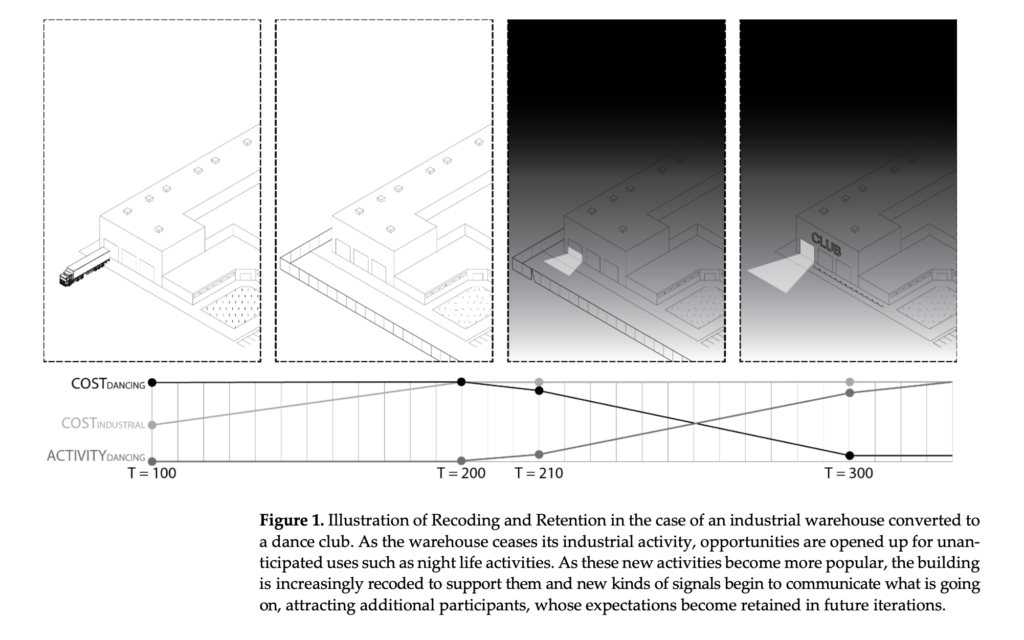
One key way that evolutionary processes occur is via feedback loops. A classic way to model such feedback loops is in functional terms. Arthur Stinchcombe articulated the elemental structure of functional explanations in his 1968 book, Constructing Social Theories. In our recently published article, “Complex causal structures of neighbourhood change,” we try to revive this model and demonstrate its value for studying the evolution of cities.
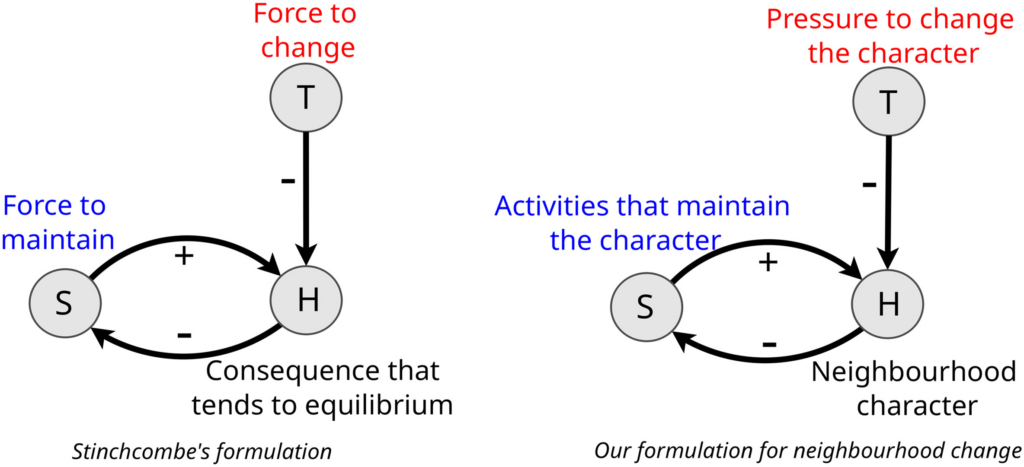
The above figures shows Stinchcombe’s model on the left, and our reformulation of the model for neighbourhood evolution. It codified the causal structure of a complete functional explanation in terms of four core elements:
The consequence that tends to be maintained, which also functions indirectly as a cause of the behaviour or social arrangement to be explained. This is H, the “Homeostatic” variable. Though H may tend to be stable empirically, its stability is maintained against pressures to change it, such as in the case of body temperature.
The social arrangement or behaviour that impacts H, the explanandum. This is S, the “Structure.” In a functional model, Structures tend to maintain Homeostasis. For example, sweat glands tend to maintain body temperature.
Tensions that tend to upset Homeostasis, unless Structures maintain it. This is T, the “tension” variable. If physical activity or air temperature did not alter body temperature, there would likely be no structure to counteract the tensions they create.
Processes that reinforce or select for the S’s (structures) that maintain H (homeostasis). When H is threatened or pressured, these forces increase the activity of S when T (tensions) are higher and decrease when H is maintained. For example, sweat glands generate more sweat (S) when body temperature (H) is not maintained at normal levels due to a certain phenomenon (T). Since this structure helps to maintain H in equilibrium, it will tend to be selected or reinforced.
Stinchcombe’s diagram may be intuitively mapped onto familiar neighbourhood dynamics. For example, we may treat as Homeostatic (H) variables neighbourhood character, style, or scene (such as distinctive shops, restaurants, venues, or groups), Tension (T) variables as pressures to change that character (from, for example, new groups with divergent tastes), and Structure (S) variables as activities that maintain that character (such as Business Improvement Association sponsored festivals, political advocacy, or increased participation in venues and activities distinctive to that scene).
Based on this simple representation, we formulate an initial set of propositions regarding the presence and strength of 1) a functional relationship and 2) a homeostatic response, which can be seen in the paper in more detail.
The key value of such models from the point of considering urban evolution is that treat both persistence and change as a dynamic process. Urban forms of life are retained when there exist structures that preserve them when new challenges. If such structures respond effectively to tensions, there is a tendency for them to be selected and reinforced over time, generating both a pattern of structural retention and possible evolutionary histories of such structures. This idea is scarred further in Part III of “Towards a Model of Urban Evolution,” in our discussion of “retention hypotheses.”
Using data drawn from Yelp.com, we find considerable evidence that the sort of functional process envisaged in the model is a common feature of urban evolution. And in the process we develop novel methods for using data from Yelp and similar sources for such analyses.
We see great potential for using these models and methods for characterizing neighbourhoods in new ways. In contrast to the typical approach, which does so primarily by their demographics or built form, our proposed functionalist approach would identify neighbourhoods with more or less latent potential to resist tensions. In this way, neighbourhoods that look otherwise similar could be shown to have very different probabilities of maintaining their identity over time, thereby allowing planners and policymakers to take these latent functional capacities into account.
While incorporating novel data sources and methods would, to some extent, be challenging, doing so would be in line with parallel proposals. Indeed, local jurisdictions routinely use big data in multiple ways: traffic demand management (using GPS and sensor data), land use (using remotely sensed data), public health (COVID sewage testing), commercial health (using payments data), and more. Our methods could be used in a similar way to monitor tendencies toward neighbourhood change.
From the point of view of social science research more generally, perhaps the biggest result of our study is the possibility of reviving interest in functional explanation. While functional explanation has been characterized as “what any science does,” it has largely fallen out of favour in social science. We review common criticisms, and show that they do not apply to a properly specific functional model of the sort we propose.
At the same time, we find considerable evidence that functionalist motifs are commonplace in neighborhood change research. Researchers typically appeal to functionalist motifs when they discuss for example the capacity of local groups to push back against tensions or challenges as a key mechanism producing continuity or change. However, we found no examples in the neighbourhood change literature where an author who utilized a functionalist motif articulated the motif in an explanatory model that would render it testable. Instead, much neighbourhood change research remains largely descriptive, mapping types and directions of change across a range of variables.
We hope one result of our study is to illustrate a path for remedying this situation, which in turn would help to more formally incorporate evolutionary thinking into urban research.
A central theoretical goal of the Urban Genome Project has been to articulate a model of urban evolution. We develop the model in four papers, recently published together in Urban Science. The paper series is called “Towards a Model of Urban Evolution,” because its central task is to elaborate a rich yet rigorous formal language capable of formulating propositions about the evolution of cities.
Paper I is “Context.”It proceeds in four major sections. First, we review prior adumbrations of an evolutionary model in urban theory, noting their potential and their limitations. Examples include Chicago School Ecology, stage theories, and theories of cities as complex adaptive systems. Second, we turn to the general sociocultural evolution literature to draw inspiration for a fresh and more complete application of evolutionary theory to the study of urban life. Third, building upon this background, we outline the main elements of our proposed model, with special attention to elaborating the value of its key conceptual innovation, the “formeme”. A formeme is a specific encoding of urban space as a combination of physical features and the groups and activities toward which they are oriented.
In turn we discuss the value of the model, highlighting its extension of the basic inferential logic of population genetics and evolutionary ecology into the urban domain, including the goal of replacing essentialist with distributional thinking, group and development thinking with tree and network ideas. Last, we conclude with a discussion of what types of research commitments the overall approach does or does not imply. Among other things, we note that an evolutionary model of the sort we develop is neither reductive nor deterministic, nor is it necessarily progressivist or teleological. We conclude by suggesting that an evolutionary approach suggests embracing new metaphors for the role of the planner: the planner less as an engineer pulling the levers of a well-tuned machine and more as a gardener in a forest, seeking to cultivate a rich ecosystem while remaining sensitive to processes unfolding through their own dynamics.
Type of Dependence
Summary
Example
Principles Related to Form Features
Scope
Formemes with wider niches will tend to attract more resources. Formemes with wider niche width will have a relativity higher probability of survival when the environment is changing, specialized forms will be favored under stable conditions
McDonalds has a wider niche width than a vegan, organic hamburger stand.McDonalds is more likely to survive a 30% increase in the local minimum wage or a pandemic than the local hamburger stand.
Content
The viability of a formeme will be influenced by its proximity to groups with a preference for or against the substantive content of its activities or the group affiliation it affirms.
Ethnic shops will tend to proliferate in areas where members of that ethnicity reside; satanic book stores will have low survival rates nearby Evangelical Christian populations.
Distance
Propagation of a formeme depends on how physically close it is to other iterations of the same formeme.
The franchise of a successful operation will be more viable at some ideal physical distance from the original
Principles related to environmental features
Density
Propagation of a formeme depends on density of competitors in the environment
Neopolitan pizza thrives when there is a glut of pizza restaurants
Frequency
Propagation of a formeme depends on the size of the formeme’s population
The 28,000th Starbucks location propagates at a different rate and in different places than the first.
Principles Governing the Evolution of Urban Form
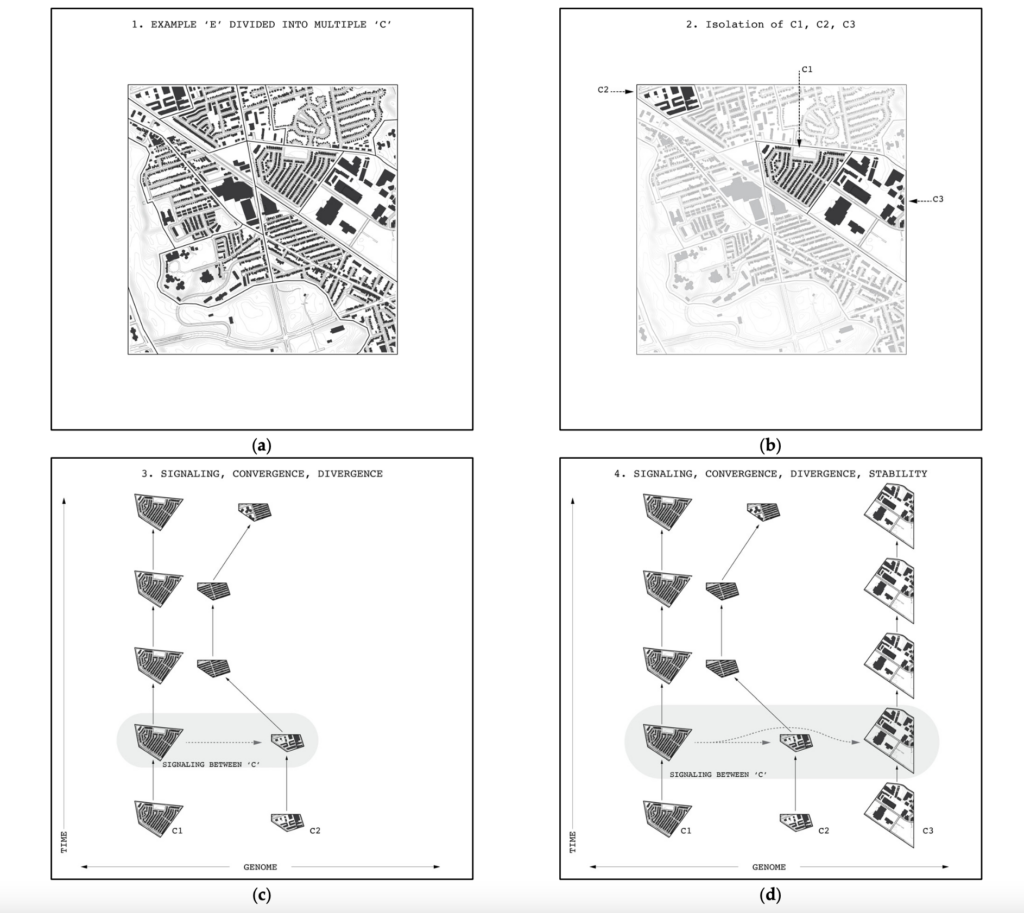
Paper II elaborates the formal model. It defines the Signature of an urban space, comprised of the information encoded in that space. This information consists of: an urban genome, which captures ideas regarding the groups (i.e., users) and activities (i.e., uses) to which a space’s physical forms are oriented; ideas among human actors regarding who (users) and how (uses) to utilize the space and its forms; and the signals that are communicated within and among urban spaces. Central to the model is the notion of the formeme, which provides the building blocks for a Signature. Formemes are units of urban information regarding physical forms, groups, and activities, which may be encoded in physical artifacts, signals, or human actors, and circulate among them. We then show how various metrics can define an urban area based on its Signature, and that these metrics can be used to measure similarity of urban spaces. The Signature, and its underlying formemes capture the sources of variations in urban evolution.
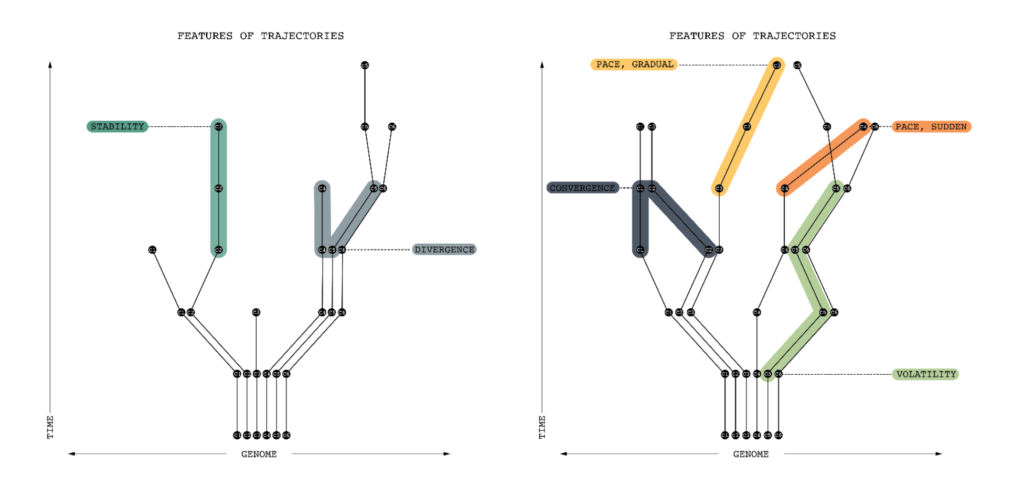
Paper III, “Rules of Evolution,” illustrates how to use the model to formulate propositions about urban evolution. It highlights (1) sources of variations; (2) principles of selection; and (3) mechanisms of retention. More specifically, regarding (1) it defines local and environmental sources of variation and identifies some of their generative processes, such as recombination, migration, mutation, extinction, and transcription errors. Regarding (2), it outlines a series of selection processes as part of an evolutionary ecology of urban forms, including density dependence, scope dependence, distance dependence, content dependence, and frequency dependence. Regarding (3), it characterizes retention as a combination of absorption and restriction of novel variants, defines mechanisms by which these can occur, including longevity, fidelity, and fecundity, and specifies how these processes issue in trajectories define by properties such as stability, pace, convergence, and divergence.
Paper IV, “Evolutionary (Formetic) Distance” provides an application of the model, using data from Yelp.com. It demonstrates how the Toronto Urban Evolution Model (TUEM) can be used to encode city data, illuminate key features, showing how formetic distance can be used to discover how spatial areas change over time, and identify similar spatial areas within and between cities. In this application, each Yelp review can be interpreted as a formeme where the category of the business is a form, the reviewer is a group, and the review is an activity. Yelp data from neighbourhoods in both Toronto and Montreal are encoded in this way. A method for aggregating reviewers into groups with multiple members is introduced. Specifically, we use the Apriori algorithm to aggregate reviewers by the types of venues they visit. Performing group aggregation using a level-wise search, this algorithm abstracts groups based on the forms they conducted reviewing activities for. Building on this basis, longitudinal analysis is performed for all Toronto neighbourhoods. Transversal analysis is performed between neighbourhoods within Toronto and between Toronto and Montreal. Similar neighbourhoods are identified validating formetic distance.
The latest edition of the School of Cities City Research Insights features the Urban Genome Project. Below is a selection, you can read the whole piece here.
“A multidisciplinary working group, established under the banner of the Urban Genome Project (UGP), is renewing connections between the life and physical sciences and the social sciences to decode the DNA of the city. Supported by the School of Cities, co-leads Daniel Silver (Sociology) and Mark Fox (Industrial Engineering and Computer Science) are exploring how the concept of evolution can apply beyond the study of living things to help us better understand our cities and the processes that influence change within them.
Originally inspired by the Human Genome Project, UGP has involved ongoing collaboration among faculty and graduate students from sociology, industrial engineering, computer science, architecture, biology, economic geography, and others at U of T and partner universities.
While the application of evolutionary concepts to cities is not entirely new, the Urban Genome Project is attempting to join them together into a novel general evolutionary model for cities. The model provides a framework for understanding how various city characteristics appear at different rates and in different places, and for understanding how those characteristics may have shared or divergent development patterns across time and space.
An urban evolutionary approach can reveal why and how certain urban characteristics – such as porches, cul-de-sacs or racial segregation – exist within cities, how those characteristics come into being, and why the number of them and how they function changes over time. Using an evolutionary lens can also tell us about how urban neighbourhoods and communities adapt to changes in built form or changing demographics, how our views of places change as the city evolves, and how to introduce policy interventions that are informed by and responsive to what is happening in a given place and time.”