line
Generative models of urban form
Continuing themes discussed in an earlier post, this paper develops a Markov model of urban evolution, using Toronto as a case study. The paper is available here (free and open access!).
It builds out the implications of some common experiences. We’ve all probably noticed that some parts of cities change fast and others look pretty much the same today like they did 20 years ago. And where things are changing, it isn’t random: a dense retail district isn’t going to change any time soon into a suburban bedroom community, or vice versa.
These are simple obervations, but following through their implications leads to some interesting insights.
1. The variability of structure. If we think of “structure” as the degree to which current conditions tend to reproduce themselves, this means that structure varies. Some places have deeply entrenched structures that are very hard to alter; others are volatile.
2. The temporality of space and the spatiality of time. Time doesn’t flow at the same pace from one place to another; part of what makes a place what it is involves how fast it is changing. Where it is coming from and where it is going is part of what it is here and now.
3. The contextuality of change. Changes of one type or another operate within a broader order that limits their likelihood of occurring elsewhere. Within certain boundaries, changes of one type to another may be very common, whereas on the other side of this horizon they can be quite rare. This means that even if change is common within these boundaries, the overall pattern of an urban system can persist.
4. Non-linear thresholds. Just as the butterfly flapping its wings far away can lead to big changes elsewhere in a complex system, small quantitative changes at key points in a complex urban order can produce large and indirect changes elsewhere.
Here are some key paragraphs that speak to these observations:
While the city exhibits a high degree of continuity, its degree of structure varies. Rather than assume there is an equally powerful structure at work throughout, an important question concerns how much of a given urban environment is structured at all, and to what degree. We find that much of Toronto is very deeply structured, so that it is highly likely to reproduce itself. In fact, some of the most “creative” parts of the city in terms of who is there and what they are doing—areas in which young, highly educated arts and technology workers predominant—are the most stable. By contrast, other parts of the city exhibit creativity where the urban fabric itself is in a state of transition in which neighbourhood forms themselves rise and fall more rapidly. There are, therefore, at least two types of urban creativity at work here. One appears to thrive within a stable urban context that supports a specific set of groups and activities; in the other, the urban form itself is in a more fluid state of experiment and transformation….
The non-counterfactual results (0 change, the darkest green dot) in Fig 6 show how the city would evolve if it continued forward according to its current trajectory. The dominant trend would be increased socioeconomic polarization: for example, elite suburban neighbourhoods would increase their share of the overall population of neighbourhoods by around 7.5 percentage points (from 8 to 15.5%), and “young urban professional” and “established creative” areas by around 5 percentage points (from 11 and 7 percent, respectively). All together, these three upper status areas would grow from around 26 to 35% of the city as a whole. At the same time, middle income diverse suburban neighbourhoods would decline (by about 5 percentage points), along with most of the city’s ethnic working and service class communities, as well as its “mixed creative” neighbourhoods. If unchecked, current trends point toward a solidification of the “divided city” [70]….
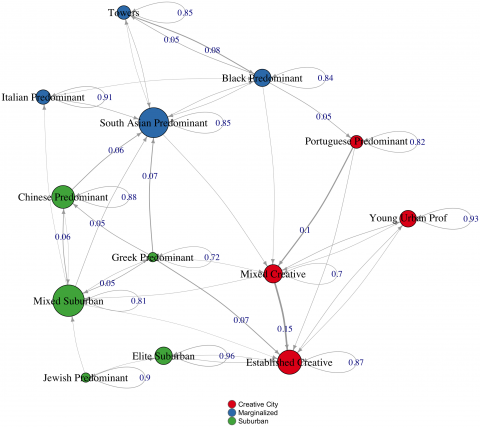
Following ideas from complexity theories of cities, we explore the extent to which small initial changes, when repeatedly iterated, can lead to relatively large and sometimes unexpected changes, both direct and indirect. Specifically, we examine different scenarios representing changes λ starting from 1% (λ = 0.01) with 1% increments up to 25% (upper-bound for a valid Markov chain in the interventions considered), to the probability that three neighborhood types—UP = {“black predominant”,“mixed suburban”, “mixed creative”}—would appear in three entrenched neighborhood types—DOWN = {“elite suburban”, “established creative”, “young urban professionals This imagined intervention represents a strategic planning decision to promote interchange among parts of the city that rarely interact and to induce change in some of the city’s most entrenched upper status areas (where reproduction rates are near or above .9). Indeed, transitions between these neighbourhood types are exceedingly rare: all are below 3% and most are near 0. Comparing these scenarios allows us to investigate threshold effects….
Three key points stand out in examining the counterfactual scenarios in Fig 6. First, in line with complexity theories, small initial changes can have big effects. In both scenarios, the growth of “young urban professional,” “elite suburban,” and “established creative” areas is substantially reduced. By contrast, the decline in the city’s occupationally and ethnically diverse areas is reduced or stabilized in “mixed creative,” “chinese predominant,” “portuguese predominant,” and “south asian predominant” areas. In some cases, such as predominantly black neighbourhoods, the trend reverses to net growth. Second, we see some signs of non-linear thresholds, again in line with complexity theories of cities. The incremental change from a .01 change in transition probabilities to a .02 change in transition probabilities generates relatively sharp downstream effects, most strikingly in the case of “young urban professional,” “elite suburban,” and “black predominant” neighbourhood types. However, the effects are non-linear and diminish at higher levels. For example, there is very little difference in the effect of a change from 12% vs. 13%. This non-linearity makes sense in the context of these specific scenarios: we are altering transitions that in the non-counterfactual scenario are very rare. Therefore, lower values (e.g. 1% or 2%) represent the initial introduction of a process that rarely occurred previously. As values increase, the process is in place, and additions do not change the situation as much beyond a certain threshold. The bunching in Fig 6 at higher values shows us approximately where this threshold is for the scenarios in this experiment. And third, we see evidence of indirect effects characteristic of complex systems. While we did not make any change to the transition probabilities for “south asian predominant” or “tower” neighbourhoods, their relative footprint in the city grew compared to the non-counterfactual scenario.
All in all, these results show that in a complex dynamic interacting system, small quantitative changes at critical points can potentially make a substantial qualitative difference. Connecting disconnected and divided upper status areas with lower status areas reduces the isolation of these parts of the city, and helps others to retain their foothold. This, in turn, reveals another sign of a complex system: changes in one part reverberate in others.

Leave a Reply
You must be logged in to post a comment.