Tag: measuring change

“Complex causal structures of neighbourhood change” is published!

One key way that evolutionary processes occur is via feedback loops. A classic way to model such feedback loops is in functional terms. Arthur Stinchcombe articulated the elemental structure of functional explanations in his 1968 book, Constructing Social Theories. In our recently published article, “Complex causal structures of neighbourhood change,” we try to revive this model and demonstrate its value for studying the evolution of cities.

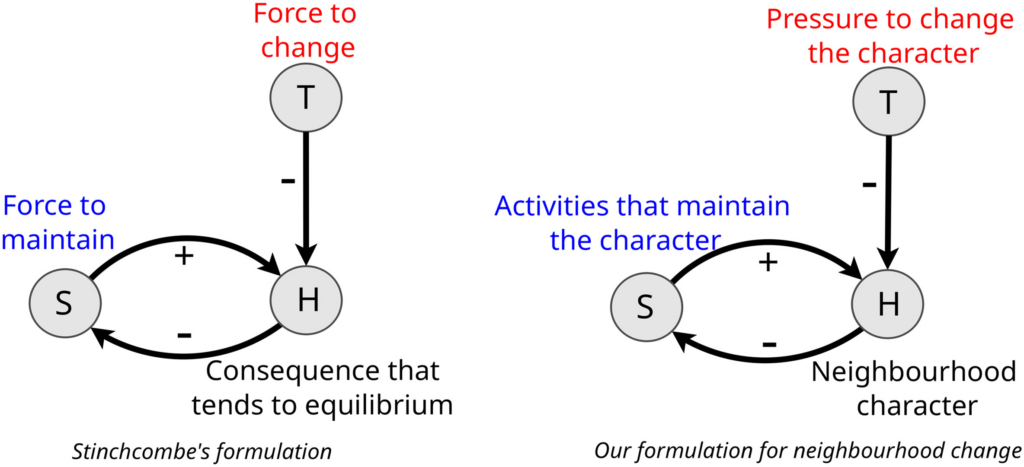
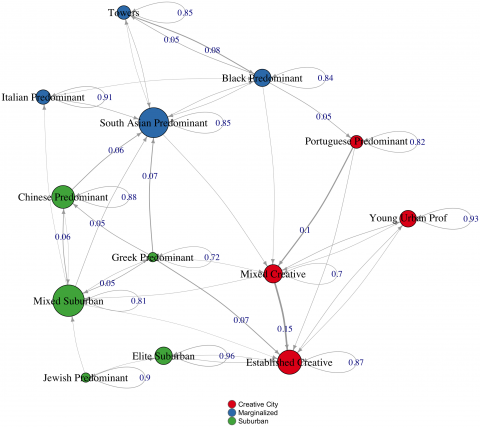
The above figures shows Stinchcombe’s model on the left, and our reformulation of the model for neighbourhood evolution. It codified the causal structure of a complete functional explanation in terms of four core elements:

  1. The consequence that tends to be maintained, which also functions indirectly as a cause of the behaviour or social arrangement to be explained. This is H, the “Homeostatic” variable. Though H may tend to be stable empirically, its stability is maintained against pressures to change it, such as in the case of body temperature.
  2. The social arrangement or behaviour that impacts H, the explanandum. This is S, the “Structure.” In a functional model, Structures tend to maintain Homeostasis. For example, sweat glands tend to maintain body temperature.
  3. Tensions that tend to upset Homeostasis, unless Structures maintain it. This is T, the “tension” variable. If physical activity or air temperature did not alter body temperature, there would likely be no structure to counteract the tensions they create.
  4. Processes that reinforce or select for the S’s (structures) that maintain H (homeostasis). When H is threatened or pressured, these forces increase the activity of S when T (tensions) are higher and decrease when H is maintained. For example, sweat glands generate more sweat (S) when body temperature (H) is not maintained at normal levels due to a certain phenomenon (T). Since this structure helps to maintain H in equilibrium, it will tend to be selected or reinforced.

Stinchcombe’s diagram may be intuitively mapped onto familiar neighbourhood dynamics. For example, we may treat as Homeostatic (H) variables neighbourhood character, style, or scene (such as distinctive shops, restaurants, venues, or groups), Tension (T) variables as pressures to change that character (from, for example, new groups with divergent tastes), and Structure (S) variables as activities that maintain that character (such as Business Improvement Association sponsored festivals, political advocacy, or increased participation in venues and activities distinctive to that scene).

Based on this simple representation, we formulate an initial set of propositions regarding the presence and strength of 1) a functional relationship and 2) a homeostatic response, which can be seen in the paper in more detail.

The key value of such models from the point of considering urban evolution is that treat both persistence and change as a dynamic process. Urban forms of life are retained when there exist structures that preserve them when new challenges. If such structures respond effectively to tensions, there is a tendency for them to be selected and reinforced over time, generating both a pattern of structural retention and possible evolutionary histories of such structures. This idea is scarred further in Part III of “Towards a Model of Urban Evolution,” in our discussion of “retention hypotheses.”


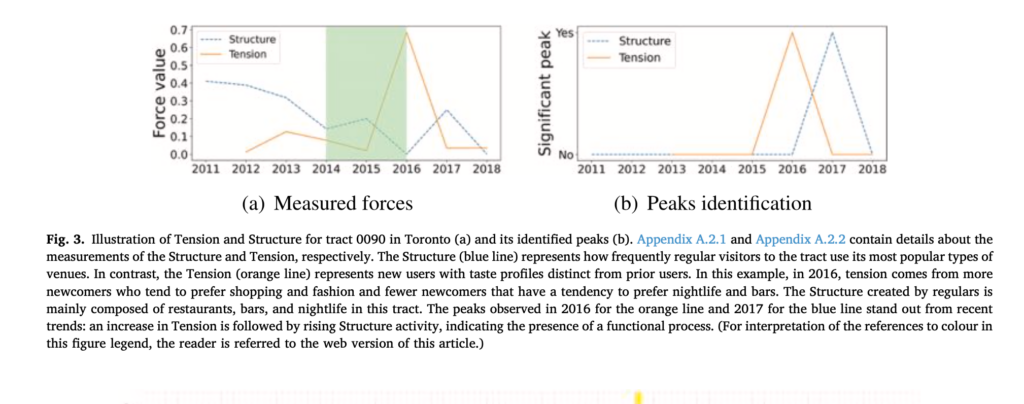
Using data drawn from Yelp.com, we find considerable evidence that the sort of functional process envisaged in the model is a common feature of urban evolution. And in the process we develop novel methods for using data from Yelp and similar sources for such analyses.

We see great potential for using these models and methods for characterizing neighbourhoods in new ways. In contrast to the typical approach, which does so primarily by their demographics or built form, our proposed functionalist approach would identify neighbourhoods with more or less latent potential to resist tensions. In this way, neighbourhoods that look otherwise similar could be shown to have very different probabilities of maintaining their identity over time, thereby allowing planners and policymakers to take these latent functional capacities into account.

While incorporating novel data sources and methods would, to some extent, be challenging, doing so would be in line with parallel proposals. Indeed, local jurisdictions routinely use big data in multiple ways: traffic demand management (using GPS and sensor data), land use (using remotely sensed data), public health (COVID sewage testing), commercial health (using payments data), and more. Our methods could be used in a similar way to monitor tendencies toward neighbourhood change.

From the point of view of social science research more generally, perhaps the biggest result of our study is the possibility of reviving interest in functional explanation. While functional explanation has been characterized as “what any science does,” it has largely fallen out of favour in social science. We review common criticisms, and show that they do not apply to a properly specific functional model of the sort we propose.

At the same time, we find considerable evidence that functionalist motifs are commonplace in neighborhood change research. Researchers typically appeal to functionalist motifs when they discuss for example the capacity of local groups to push back against tensions or challenges as a key mechanism producing continuity or change.  However, we found no examples in the neighbourhood change literature where an author who utilized a functionalist motif articulated the motif in an explanatory model that would render it testable. Instead, much neighbourhood change research remains largely descriptive, mapping types and directions of change across a range of variables.

We hope one result of our study is to illustrate a path for remedying this situation, which in turn would help to more formally incorporate evolutionary thinking into urban research.

new paper published! A Markov model of urban evolution: Neighbourhood change as a complex process

line
Generative models of urban form

Continuing themes discussed in an earlier post, this paper develops a Markov model of urban evolution, using Toronto as a case study. The paper is available here (free and open access!).

It builds out the implications of some common experiences. We’ve all probably noticed that some parts of cities change fast and others look pretty much the same today like they did 20 years ago. And where things are changing, it isn’t random: a dense retail district isn’t going to change any time soon into a suburban bedroom community, or vice versa.

These are simple obervations, but following through their implications leads to some interesting insights.

1. The variability of structure. If we think of “structure” as the degree to which current conditions tend to reproduce themselves, this means that structure varies. Some places have deeply entrenched structures that are very hard to alter; others are volatile.

2. The temporality of space and the spatiality of time. Time doesn’t flow at the same pace from one place to another; part of what makes a place what it is involves how fast it is changing. Where it is coming from and where it is going is part of what it is here and now.

3. The contextuality of change. Changes of one type or another operate within a broader order that limits their likelihood of occurring elsewhere. Within certain boundaries, changes of one type to another may be very common, whereas on the other side of this horizon they can be quite rare. This means that even if change is common within these boundaries, the overall pattern of an urban system can persist.

4. Non-linear thresholds. Just as the butterfly flapping its wings far away can lead to big changes elsewhere in a complex system, small quantitative changes at key points in a complex urban order can produce large and indirect changes elsewhere.

Here are some key paragraphs that speak to these observations:

While the city exhibits a high degree of continuity, its degree of structure varies. Rather than assume there is an equally powerful structure at work throughout, an important question concerns how much of a given urban environment is structured at all, and to what degree. We find that much of Toronto is very deeply structured, so that it is highly likely to reproduce itself. In fact, some of the most “creative” parts of the city in terms of who is there and what they are doing—areas in which young, highly educated arts and technology workers predominant—are the most stable. By contrast, other parts of the city exhibit creativity where the urban fabric itself is in a state of transition in which neighbourhood forms themselves rise and fall more rapidly. There are, therefore, at least two types of urban creativity at work here. One appears to thrive within a stable urban context that supports a specific set of groups and activities; in the other, the urban form itself is in a more fluid state of experiment and transformation….

The non-counterfactual results (0 change, the darkest green dot) in Fig 6 show how the city would evolve if it continued forward according to its current trajectory. The dominant trend would be increased socioeconomic polarization: for example, elite suburban neighbourhoods would increase their share of the overall population of neighbourhoods by around 7.5 percentage points (from 8 to 15.5%), and “young urban professional” and “established creative” areas by around 5 percentage points (from 11 and 7 percent, respectively). All together, these three upper status areas would grow from around 26 to 35% of the city as a whole. At the same time, middle income diverse suburban neighbourhoods would decline (by about 5 percentage points), along with most of the city’s ethnic working and service class communities, as well as its “mixed creative” neighbourhoods. If unchecked, current trends point toward a solidification of the “divided city” [70]….

Following ideas from complexity theories of cities, we explore the extent to which small initial changes, when repeatedly iterated, can lead to relatively large and sometimes unexpected changes, both direct and indirect. Specifically, we examine different scenarios representing changes λ starting from 1% (λ = 0.01) with 1% increments up to 25% (upper-bound for a valid Markov chain in the interventions considered), to the probability that three neighborhood types—UP = {“black predominant”,“mixed suburban”, “mixed creative”}—would appear in three entrenched neighborhood types—DOWN = {“elite suburban”, “established creative”, “young urban professionals This imagined intervention represents a strategic planning decision to promote interchange among parts of the city that rarely interact and to induce change in some of the city’s most entrenched upper status areas (where reproduction rates are near or above .9). Indeed, transitions between these neighbourhood types are exceedingly rare: all are below 3% and most are near 0. Comparing these scenarios allows us to investigate threshold effects….

Three key points stand out in examining the counterfactual scenarios in Fig 6. First, in line with complexity theories, small initial changes can have big effects. In both scenarios, the growth of “young urban professional,” “elite suburban,” and “established creative” areas is substantially reduced. By contrast, the decline in the city’s occupationally and ethnically diverse areas is reduced or stabilized in “mixed creative,” “chinese predominant,” “portuguese predominant,” and “south asian predominant” areas. In some cases, such as predominantly black neighbourhoods, the trend reverses to net growth. Second, we see some signs of non-linear thresholds, again in line with complexity theories of cities. The incremental change from a .01 change in transition probabilities to a .02 change in transition probabilities generates relatively sharp downstream effects, most strikingly in the case of “young urban professional,” “elite suburban,” and “black predominant” neighbourhood types. However, the effects are non-linear and diminish at higher levels. For example, there is very little difference in the effect of a change from 12% vs. 13%. This non-linearity makes sense in the context of these specific scenarios: we are altering transitions that in the non-counterfactual scenario are very rare. Therefore, lower values (e.g. 1% or 2%) represent the initial introduction of a process that rarely occurred previously. As values increase, the process is in place, and additions do not change the situation as much beyond a certain threshold. The bunching in Fig 6 at higher values shows us approximately where this threshold is for the scenarios in this experiment. And third, we see evidence of indirect effects characteristic of complex systems. While we did not make any change to the transition probabilities for “south asian predominant” or “tower” neighbourhoods, their relative footprint in the city grew compared to the non-counterfactual scenario.

All in all, these results show that in a complex dynamic interacting system, small quantitative changes at critical points can potentially make a substantial qualitative difference. Connecting disconnected and divided upper status areas with lower status areas reduces the isolation of these parts of the city, and helps others to retain their foothold. This, in turn, reveals another sign of a complex system: changes in one part reverberate in others.

New paper published!: Classification and Regression via Integer Optimization for Neighborhood Change

line

Mapping the evolution of cities

A challenging part of developing evolutionary models of cities is their dynamism. We must find ways to treat change rather than static states as our topic of interest. That is, we often want to understand what something is by how it becomes. Two neighbourhoods might be very similar in terms of their characteristics right now, but have very different propensities to change. Likewise, two neighbourhoods might be quite different at the present moment, but change in similar ways. However, standard methods have a hard time identifying these sorts of similarities grounded in shared propensities to change in response to varying conditions. 

Classification and Regression via Integer Optimization for Neighborhood Change” proposes a new method designed to do just that, through a method we term “predictive clustering.” As the paper notes, the predictive clustering approach makes three key contributions to neighbourhood change research more broadly:

• Conceptually, predictive clustering is highly distinct from traditional methods—in particu-lar, LR. Because it relies on a predictive model, it can uncover how specific characteristics influence an outcome researchers are interested in studying. We can then observe heteroge-neity in those influences and use it to cluster observations. This perspective makes neigh-borhood dynamics fundamental to the definition of urban space.

• Methodologically, in contrast to traditional neighborhood classifications, predictive cluster-ing is based on a specific outcome to which areas similarly “respond.” In other words, our proposal can be considered model-based clustering (Fraley and Raftery 2002). This frame-work defines the current state of a neighborhood as a set of variables thought to influence trajectories of change. In this article, following a long tradition of research, we use income change to illustrate the potential of this methodological feature of our approach (for a recent example, see Hochstenbach and Van Gent 2015).

• Practically, predictive clustering has clear implications that differentiate it from the tradi-tional K-Means approach. Our approach can identify neighborhoods that exhibit different processes of change even if they look similar at any given point in time, and similar dynam-ics even when they look different. Not only is this potentially useful for urban policymakers when designing interventions, it cannot be readily examined when one only considers char-acteristics of the neighborhood, as in the traditional K-Means approach.

Below is the abstract, and here is a link to the paper. 

Abstract: 

This article applies a method we term “predictive clustering” to cluster neighborhoods. Much of the literature in this direction is based on groupings built using intrinsic characteristics of each observation. Our approach departs from this framework by delineating clusters based on how the neighborhood’s features respond to a particular outcome of interest (e.g., income change). To do so, we leverage a classification and regression via integer optimization (CRIO) method that groups neighborhoods according to their predictive characteristics and consistently outperforms traditional clustering methods along several metrics. The CRIO methodology contributes a novel methodological and conceptual capability to the literature on neighborhood dynamics that can provide useful insights for policymaking.