Category: Blog Entry (Page 2 of 4)

Venues can unsettle sedimented patterns of segregation under certain conditions: addendum to “Venues and segregation: A revised Schelling model”

line
Generative models of urban form

In Venues and segregation: A revised Schelling model we demonstrate that venues can play a crucial role in shaping urban evolution, in particular through influencing broader patterns of integration and segregation. Due to space considerations, we could not include a key study in the paper.

This study investigates whether and how venues can diversify a segregated city after it a particular segregation pattern has become deeply entrenched. To answer this question, we first simulate a highly segregated city as an outcome of a standard Schelling process. Then we use a genetic algorithm to evolve the set of rules that would most decrease the degree of segregation. These rules include the location of venues, their exclusivity, and their degree of obligatoriness. In effect, the study evolves rules that would most dramatically alter the evolutionary direction of a city.

The study is below. See the original paper for more details regarding the parameters and graphical conventions, and simulation rules. 

Venues can unsettle sedimented patterns of segregation under certain conditions.

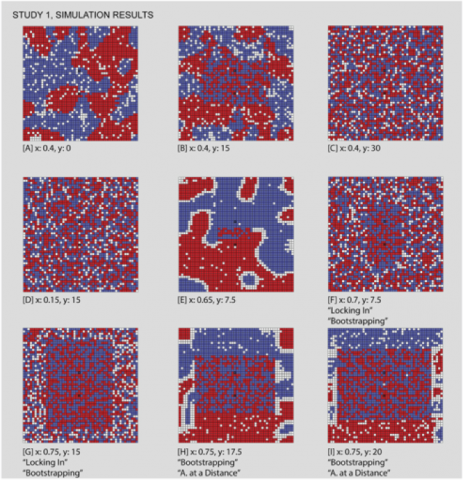
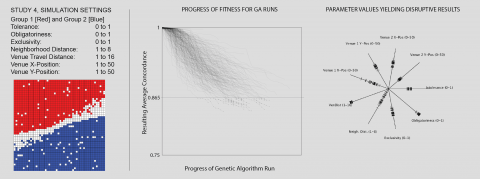
In this study, we demonstrate that the strategic placement of a new venue can unsettle sedimented patterns of segregation. This is important because one of the characteristics of the segregation patterns generated in Schelling simulations is that they are highly uni-directional processes. Once a set of individuals has become segregated, even a significant increase in their tolerance will not undo the neighbourhood divisions that have taken shape – barring any modifications to the internal psychology of individuals within the simulation. In this study, we show that venues can be used as an intervention within a settled Schelling model in order to disrupt the segregated outcome, without requiring any change to agents’ psychology. To do so, we add venues to a venue-less simulation that has already run its course and achieved a high level of segregated stability. In order to effectively determine what input parameters and venue positions will provide the most disruption, the two-dimensional parameter spaces used to explore earlier studies is not sufficient. Here we consider a range of venue positions, exclusivity, obligatoriness, tolerance, travel distance, and neighbourhood distance values simultaneously. In lieu of our prior interval based approach, we employ a Genetic Algorithm to test and recombine values for these parameters, evaluating different combinations in terms of how much they disrupt the initial condition (measured as a drop in concordance from the initial, segregated condition). An additional mechanism emerges, whereby one group’s venue establishes a “beachhead” into an area predominated by the other.

Figure 1 displays results. After running the algorithm with a variety of population sizes, mutation rates, and crossover rates, the progress of each evolutionary process is mapped as a sequence of fitness values to the chart in center of Fig 1.  Here, movement towards the right along each thread indicates the progress of the algorithm during one of its runs, while dropping values on the Y-axis indicate a reduction in the resulting concordance, i.e. a more successful solution. We select the most successful interventions in order to compare their values for each input parameter in the chart to the right in Fig 1.  Here, each notch along one of the spokes indicates a parameter value for one of the interventions, and hence, each intervention can be composed from a set of notches on each of the spokes.

FIG 1 HERE.

Beginning from “Intolerance” and working clockwise through the spokes on Fig. 1, we consider the significance of the values arrived at for each, highlighting values that contribute to disruptive solutions. Overall, these solutions cluster around medium-low intolerance levels, high obligatoriness, middling exclusiveness, high catchment areas, a wide range of neighbourhood distances, and “beachhead” venue positions.

Intolerance: The intolerance values are clustered tightly around the value of 0.4 in successfully disruptive solutions. This value, just above the traditional Shelling tipping point, can be understood as a trade-off: it is high enough to motivate some movement by individuals, but low enough to support these same agents moving to an integrated rather than segregated destination.

Obligatoriness: The obligatoriness values tend towards 1 in disruptive solutions. Since obligatoriness controls the fraction of individuals that will feel compelled to visit venues, and since venues are the mechanism for disrupting the settled state, it follows that maximizing venue attendance will maximize the potential disruption. By contrast, introducing venues that inspire no obligation to attend them will do little to alter a segregated condition.

Exclusivity: Since exclusivity controls the number of other-group individuals who will consider visiting a venue, it regulates the new encounters between the segregated groups. It follows that an exclusivity of less than 1 is necessary in order to yield any new outcomes.  On the other hand, if the exclusivity is too low, any agents within the travel distance would visit and it would hence replicate the distribution of the surrounding area. Between these extremes, and in fact closer to an exclusivity range from 0.4 to 0.6, we have circumstances in which some individuals of the opposite group will be drawn into a venue, leading to a disruption when they find that after visiting they are no longer comfortable with their location. Thus maximizing disruption involves introducing venues that are neither too exclusive nor too open but rather those that exist in a “sweet spot” between the two extremes.

Neighbourhood Distance: The neighbourhood distance is the most dispersed of the non-location parameters, with all of its distribution occurring below a value of 4. We interpret this to imply that neighbourhood distance does not play a significant role in the outcome, so long as it is sufficiently low.

Venue Travel Distance: Unlike neighbourhood distance, the venue travel distance is very tightly clustered, and tends towards the highest value possible.  Since venue travel distance directly determines the number of individuals who can be affected by the venues, higher values naturally yield more disruptive results. Thus introducing venues with large catchment areas is likely crucial to interventions designed to unsettle existing patterns of segregation.

Venue Positions: Each of the two venues’ positions are encoded as an X and Y value between 1 and 50. This allows them to be located anywhere in the simulation world, even if this means displacing an individual from their initial condition. While their positions in successful solutions are mostly constrained to a narrow range, the X position of the first venue is something of an exception – with a whole range of positions that yield disruptions. In Fig 2, we summarize our findings for the venues’ positions by stepping through each cell, finding any simulations in which one of the venues occupies this cell, and colouring the cell according to the most disruptive outcome from among these simulations. In other words, we colour each square according to a best-case scenario of having a venue located there.  What results is a map of the most effective positions for locating venues.

FIGURE 2 HERE.

Venues at “beachheads” are most likely to disrupt stable segregation patterns.Though the central map of Fig 2 clearly illustrates that there is a broad band of more successful venue locations along the boundary area between the two segregated groups, closer inspection reveals that ideal positions tend to be slightly embedded within one of the groups, rather than in the unoccupied space between. The tight clustering of values for the other parameters suggest that the successful disruptive runs are all variations on a single, emergent, strategy.  This strategy involves locating a relatively open venue of a group (G1) near to the edge but slightly embedded within the segregated neighbourhood of the opposite group (G2).  Because of the high maximum travel distance, individuals from the G1 are able to visit from farther away, while some closer agents from G2 are welcomed by the low exclusivity.  Upon visiting, these G2 agents become less comfortable with their location, since attendance has exposed them to a greater number of agents from G1. Simultaneously, the opposite dynamic is unfolding somewhere else in the simulation world. Because of this symmetry, individuals from both groups who feel compelled to move will find new locations opening up within travel distance to an appropriate venue, leading to an exchange between two areas of the simulation world.  Since the venue exclusivity is not too low, this exchange is not a complete flip – only the fraction of individuals who visit the opposite venue will relocate. These venues act like a “beachhead”, pushing away individuals from the other group and opening up spaces for their own agents to occupy. We can watch this same dynamic unfolding in the Video.

Summary

In this study,  we consider the possibility of applying our venue model as an intervention in highly segregated conditions. The success of the genetic algorithm in finding highly disruptive venue configurations speaks to the potential role for planning and design as a means of re-integrating a divided urban condition.  It must be stressed that the successful strategy described in this study is specifically tuned to the particular starting conditions that were used. Nonetheless, this study points at specific spatial relationships between segregated groups and disruptive venues as well as the crucial balancing of parameters such as intolerance and exclusivity. Further research would be necessary to generalize these results for other kinds of initial distributions of the simulated population.

New paper published! Venues and segregation: A revised Schelling model

line
Generative models of urban form

simulations

It goes without saying that most of our lives are spent in buildings. Less obvious are the implications of this obvious fact.

Consider a two-dimensional map. It presents a smooth surface, but the reality it represents is warped. Certain points on it support more interaction than others: the ones with buildings on them. Being near such a point puts you in close contact with more people than elsewhere. Depending on the social rules governing who is supposed to be there and what they are supposed to do, the building may increase or decrease your chances of coming into contact with people similar to or different from yourself.

They are not just physical structures, they are venues for social life, and the social order of cities grow up around them. If they change — their number and distribution, their rules of social inclusion or exclusion, the types of activity they afford — the city changes as well. This combination of forms, groups, and activities is the anchor of our model of urban evolution

In a new paper (with Ultan Byrne and Patrick Adler), we show via computer simulations the power of venues to affect the broader urban order by shaping the interactions of individuals. We do so by building upon the classic work of Thomas Schelling/ In 1971, Schelling proposed what became known as the “Schelling model of segregation,” which expressed in an especially clear way the type of thinking for which he eventually received the Nobel prize: local, small-scale interactions generate larger aggregate structures, often in surprising ways.

The “Schelling model of segregation” shows this vividly. Imagine a checkerboard with red and blue pieces that represent individuals. Let’s say each individual has a desire to be around people of their own group. Let’s make it relatively small: a red individual wants at least 25-30% of the others around them to be red, otherwise the’ll move to a different location where this condition is met, if they can.

Schelling showed that, starting from a random distribution of reds and blues, if you repeat this process over and over again you’ll end up with basically total segregation of red and blue. The map that results looks eerily like real cities.

The irony is that, within the Schelling model, no individual agent wants this outcome. The social structure is not necessarily a direct result of individual intentions. Moreover, once that pattern of segregation sets in, outside of a radical transformation of human psychology, little can be done to alter it (within this model).

This is a model and like any model it makes many simplifying assumptions. In our paper, we think through the implications of something maybe so simple that prior studies of this model have largely overlooked: there are no buildings in it, it does not capture the warped space we live in.

So we built a model that extends Schelling’s to include buildings in the simplest way we could think of. Basically, you need four things: 1. a travel radius (how far your reds and blues will go to visit the venue); 2. exclusivity (is the venue exclusive to one group, like an exclusive golf club, or is it open to members of any group); 3. obligatoriness (are individuals obliged to attend it, like an orthodox synagogue, or is it more optional, like a cafe); 4. physical features (how many venues are there, and where are they located).

With those simple features, you can account for, and observe the logical implications for urban segregation and integration, of one of the most pervasive facts of our experience, which is that we congregate in buildings. This happens because the people you interact with in buildings alter the Schelling-style calculation as to whether an individual feels “comfortable” in their location. One might be a majority in terms of the people who live nearby or who you pass by on the street, but a minority when you include those you meet in the venues. Or vice versa: you might be a minority in terms of who lives there, but interact with many people of your group in the local venues (who traveled there from elsewhere) or travel elsewhere to interact with members of your group.

By repeating and varying those simple processes you can think through their implications. One is that they generate a distinctively urban order: Schelling’s model yields clumps whose physical location has no meaning or basis. With buildings in the model, you can generate an East vs. West side (“opposite sides of the tracks”) or a centre-periphery structure with a more diverse core and more homogenous peripheries.

You can also observe how, depending on the characteristics and location of the building, it is possible to forestall the deep segregation characteristic of the Schelling model from arising, without requiring any radical transformation of individuals’ psychology. You can also unsettle deeply sedimented patterns of segregation through the right combination of venue parameters, whereas they are basically set in stone in Schelling’s highly individualistic model (via a genetic algorithm, not shown in this paper but coming to a blog post soon)

And you can find ironies and reversals like the sort Schelling exposed. Just as Schelling demonstrated that one cannot simply read individual intentions from collective patterns of behavior, one cannot simply read organizational values from their surrounding patterns of segregation. Relatively exclusive venues can generate diverse neighborhoods (by providing a local foothold for minority groups to sustain their distinctive cultures), while relatively inclusive venues can in some circumstances produce highly segregated areas (by drawing in tolerant and “adventurous” persons who, despite their individual understanding, change the overall makeup of the area).

An advantage of the computer simulation approach is that you can pinpoint the precise mechanisms by which these outcomes occur. Some of these include “evacuation,” “cooptation,” “bootstrapping,” “cascading,” and “bridging.” 

The paper also includes videos showing the simulation runs unfold. 

The abstract is below. The paper is freely available here.

Abstract: This paper examines an important but underappreciated mechanism affecting urban segregation and integration: urban venues. The venue- an area where urbanites interact- is an essential aspect of city life that tends to influence residential location. We study the venue/segregation relationship by overlaying venues onto Schelling’s classic (1971) agent-based segregation model. We show that a simulation world with venues makes segregation less likely among relatively tolerant agents and more likely among the intolerant. We also show that multiple venues can create spatial structures beyond their catchment areas and that the initial location of venues shapes later residential patterns. Finally, we demonstrate that the social rules governing venue participation alter their impacts on segregation. In the course of our study, we compile techniques for advancing Schelling-style studies of urban environments and catalogue a set of mechanisms that operate in this environment.

new paper published! A Markov model of urban evolution: Neighbourhood change as a complex process

line
Generative models of urban form

Continuing themes discussed in an earlier post, this paper develops a Markov model of urban evolution, using Toronto as a case study. The paper is available here (free and open access!).

It builds out the implications of some common experiences. We’ve all probably noticed that some parts of cities change fast and others look pretty much the same today like they did 20 years ago. And where things are changing, it isn’t random: a dense retail district isn’t going to change any time soon into a suburban bedroom community, or vice versa.

These are simple obervations, but following through their implications leads to some interesting insights.

1. The variability of structure. If we think of “structure” as the degree to which current conditions tend to reproduce themselves, this means that structure varies. Some places have deeply entrenched structures that are very hard to alter; others are volatile.

2. The temporality of space and the spatiality of time. Time doesn’t flow at the same pace from one place to another; part of what makes a place what it is involves how fast it is changing. Where it is coming from and where it is going is part of what it is here and now.

3. The contextuality of change. Changes of one type or another operate within a broader order that limits their likelihood of occurring elsewhere. Within certain boundaries, changes of one type to another may be very common, whereas on the other side of this horizon they can be quite rare. This means that even if change is common within these boundaries, the overall pattern of an urban system can persist.

4. Non-linear thresholds. Just as the butterfly flapping its wings far away can lead to big changes elsewhere in a complex system, small quantitative changes at key points in a complex urban order can produce large and indirect changes elsewhere.

Here are some key paragraphs that speak to these observations:

While the city exhibits a high degree of continuity, its degree of structure varies. Rather than assume there is an equally powerful structure at work throughout, an important question concerns how much of a given urban environment is structured at all, and to what degree. We find that much of Toronto is very deeply structured, so that it is highly likely to reproduce itself. In fact, some of the most “creative” parts of the city in terms of who is there and what they are doing—areas in which young, highly educated arts and technology workers predominant—are the most stable. By contrast, other parts of the city exhibit creativity where the urban fabric itself is in a state of transition in which neighbourhood forms themselves rise and fall more rapidly. There are, therefore, at least two types of urban creativity at work here. One appears to thrive within a stable urban context that supports a specific set of groups and activities; in the other, the urban form itself is in a more fluid state of experiment and transformation….

The non-counterfactual results (0 change, the darkest green dot) in Fig 6 show how the city would evolve if it continued forward according to its current trajectory. The dominant trend would be increased socioeconomic polarization: for example, elite suburban neighbourhoods would increase their share of the overall population of neighbourhoods by around 7.5 percentage points (from 8 to 15.5%), and “young urban professional” and “established creative” areas by around 5 percentage points (from 11 and 7 percent, respectively). All together, these three upper status areas would grow from around 26 to 35% of the city as a whole. At the same time, middle income diverse suburban neighbourhoods would decline (by about 5 percentage points), along with most of the city’s ethnic working and service class communities, as well as its “mixed creative” neighbourhoods. If unchecked, current trends point toward a solidification of the “divided city” [70]….

Following ideas from complexity theories of cities, we explore the extent to which small initial changes, when repeatedly iterated, can lead to relatively large and sometimes unexpected changes, both direct and indirect. Specifically, we examine different scenarios representing changes λ starting from 1% (λ = 0.01) with 1% increments up to 25% (upper-bound for a valid Markov chain in the interventions considered), to the probability that three neighborhood types—UP = {“black predominant”,“mixed suburban”, “mixed creative”}—would appear in three entrenched neighborhood types—DOWN = {“elite suburban”, “established creative”, “young urban professionals This imagined intervention represents a strategic planning decision to promote interchange among parts of the city that rarely interact and to induce change in some of the city’s most entrenched upper status areas (where reproduction rates are near or above .9). Indeed, transitions between these neighbourhood types are exceedingly rare: all are below 3% and most are near 0. Comparing these scenarios allows us to investigate threshold effects….

Three key points stand out in examining the counterfactual scenarios in Fig 6. First, in line with complexity theories, small initial changes can have big effects. In both scenarios, the growth of “young urban professional,” “elite suburban,” and “established creative” areas is substantially reduced. By contrast, the decline in the city’s occupationally and ethnically diverse areas is reduced or stabilized in “mixed creative,” “chinese predominant,” “portuguese predominant,” and “south asian predominant” areas. In some cases, such as predominantly black neighbourhoods, the trend reverses to net growth. Second, we see some signs of non-linear thresholds, again in line with complexity theories of cities. The incremental change from a .01 change in transition probabilities to a .02 change in transition probabilities generates relatively sharp downstream effects, most strikingly in the case of “young urban professional,” “elite suburban,” and “black predominant” neighbourhood types. However, the effects are non-linear and diminish at higher levels. For example, there is very little difference in the effect of a change from 12% vs. 13%. This non-linearity makes sense in the context of these specific scenarios: we are altering transitions that in the non-counterfactual scenario are very rare. Therefore, lower values (e.g. 1% or 2%) represent the initial introduction of a process that rarely occurred previously. As values increase, the process is in place, and additions do not change the situation as much beyond a certain threshold. The bunching in Fig 6 at higher values shows us approximately where this threshold is for the scenarios in this experiment. And third, we see evidence of indirect effects characteristic of complex systems. While we did not make any change to the transition probabilities for “south asian predominant” or “tower” neighbourhoods, their relative footprint in the city grew compared to the non-counterfactual scenario.

All in all, these results show that in a complex dynamic interacting system, small quantitative changes at critical points can potentially make a substantial qualitative difference. Connecting disconnected and divided upper status areas with lower status areas reduces the isolation of these parts of the city, and helps others to retain their foothold. This, in turn, reveals another sign of a complex system: changes in one part reverberate in others.

Seminar with Yaara Rosner-Manor

line
Population formetics and the circulation of urban forms

In the the third instalment of this year’s seminar series, we continued to host a dialogue about the adaptation of evolutionary thinking to the study of cities. We were delighted to host Ya’ara Rosner-Manor from Ben-Gurion University and the Urban Clinic.

Dr. Rosner-Manor is the author of very interesting research on “the adaptation of urban codes” from one place to another. This work aligns with own theorizing in Parts III, and III of “Towards a Model of Urban Evolution,” which thanks to Dr. Rosner-Manor’s critical commentary we will continue to revise, in particular through closer engagement with the ideas of Christopher Alexander.

For our seminar, Dr. Rosner-Manor presented a paper on “Stigmergy in informal communities: The unrecognized Bedouin settlements in the Negev, Israel.” The abstract is below.


Informal settlements seem to lack order and are often regarded by the authorities as holding no value, when planning for rebuilding of the same area or for the relocation of the population to legitimate urbanized areas. In this paper we show, in the case of the Bedouin Villages in the Israeli desert, that consistent patterns of spatial order can be discerned in the way those informal settlements self-organize. Often these patterns reflect unique connections among the community’s social structure and the environments in which they exist. These connections, we argue, are fundamental for the future wellbeing of the community.

Drawing from the study of complex systems, we use the explanatory framework of ‘Stigmergy’ to evaluate the relations observed between social coordination and spatial order in the Bedouin villages in the Israeli Negev desert. Stigmergy, most generally, describes the collective phenomenon of indirect communication and coordination mediated by modifications of the shared environment. In this paper, it is used to identify significant socio-spatial patterns anchoring the traditional narrative of these communities to the structure of the environment they inhabit. 

New paper published! Reading the city through its neighbourhoods: Deep text embeddings of Yelp reviews as a basis for determining similarity and change

line
Mapping the evolution of cities

A central component of our model of urban evolution is Signals. Signals are representations or messages that convey information about the forms, groups, and activities that characterize a place. In the contemporary city, social media review sites are increasingly important Signals. They mediate the information a potential user receives about a place, and in turn potentially shape their ideas about the sort of activities, people, and forms they can expect to encounter. 

In this study, we develop methodologies for “reading the city” through the signals conveyed through Yelp reviews. We show that Yelp reviews provide a window onto the collective representations of a city and its neighbourhoods. The methodology enables us to identify stability and change as well as convergence and divergence among neighbourhood representations. This technique can form the basis for a kind of sociological observatory that tracks not only trends in business activity but also in the latent collective meaning of places.

The abstract is below, along with some key conclusions. The paper is published here, and a pre-print can be freely accessed here.


Abstract: This paper develops novel methods for using Yelp reviews as a window into the collective representations of a city and its neighbourhoods. Basing analysis on social media data such as Yelp is a challenging task because review data is highly sparse and direct analysis may fail to uncover hidden trends. To this end, we propose a deep autoencoder approach for embedding the language of neighbourhood-based business reviews into a reduced dimensional space that facilitates similarity comparison of neighbourhoods and their change over time. Our model improves performance in distinguishing real and fake neighbourhood descriptions derived from real reviews, increasing performance in the task from an average accuracy of 0.46 to 0.77. This improvement in performance indicates that this novel application of embedded language analysis permits us to uncover comparative trends in neighbourhood change through the lens of their venues’ reviews, providing a computational methodology for reading a city through its neighbourhoods. The resulting toolkit makes it possible to examine a city’s current sociological trends in terms of its neighbourhoods’ collective identities.

This ability to identify areas with coherent and stable meaning on the basis of review texts is a central contribution of this paper. Most research uses qualitative and survey methods to identify shared local meaning, often suggesting linkages between neighbourhood identity, solidarity, and local advocacy. Our techniques capture similar information about identity and a platform for pursuing such linkages, but in a way that is scalable, reliable, and more systematically comparable.

An additional benefit of our approach concerns the fact that even the most stable neighbourhoods do have vocabulary change, despite mini- mal semantic change. This is a key feature of the embedding space: the vocabulary itself is discarded, and meaning is retained. However, as a result of this, it is critical to note that individual words may easily change year-on-year, even in the most stable neighbourhood. The col- lective meaning of an area transcends changes in specific words, such that a neighbourhood like the Annex is consistently recognized as hav- ing a similar meaning within the discursive space of the city, even if specific words used to describe it change. This is an example of how the computational analysis pursued here carries forward key ideas from cultural research, namely about the holistic and relational character of meaning….

The high degree of accuracy that the classifier was able to obtain in the low dimensional space demonstrates the validity of using this review space to examine neighbourhoods. It is important to emphasize that the ‘fake’ neighbourhoods are indeed real, contiguous sections of the city, meaning that the model was able to distinguish at a high conceptual level the differences between these two sets. Reviews reliably map onto the real neighbourhoods, and the official neighbourhoods exhibit coherent meanings….

…These techniques might be considered a form of sociological observatory to complement recent uses of Yelp data for economic monitoring. The economic version uses social media data to identify patterns and trends in business activity before or beyond what official government data permit. Our sociological version uses similar data to identify patterns and trends in collective representations and identities. As a result of this, it expands the range of approaches available to researchers, allowing for more nuanced and effective research of neighbourhood change.

Seminar with Juste Raimbault

line

Generative models of urban form

In the the second instalment of this year’s seminar series, we continued to host a dialogue about the adaptation of evolutionary thinking to the study of cities. We were delighted to host Juste Raimbault, from University College London.

Dr. Raimbault is the author of a stream of very interesting work on theories and models of urban evolution, coupled with epistemological insights about the value and meaning of interdisciplinarity. This work informs own theorizing in Parts III, and III of “Towards a Model of Urban Evolution” — which thanks to Dr. Raimbault’s critical commentary we will continue to revise under the more appropriate heading, “Towards a meta-model of urban evolution.”  

For our seminar, Dr. Raimbault presented his paper on “Modelling urban evolution and co-evolution in systems of cities.? The abstract is below, and a recording of the presentation may be viewed here

Systems of cities are adaptive complex systems, which have been theorized and modelled from many viewpoints and by different disciplines. Understanding the processes driving their dynamics is a crucial challenge for sustainable urban and territorial planning. The concept of urban evolution has proved relevant in this regard. This presentation summarises recent results obtained within the frame of the Evolutionary Urban Theory, a geographical approach to urban systems dynamics developed for more than 20 years by Denise Pumain and collaborators. We first review the main theoretical assumptions underlying this theory and results obtained with different simulation models in previous works. We also highlight the role of new model exploration and validation practices and tools developed in that context, implemented in the OpenMOLE platform.

We then describe a model of urban evolution positioned in this approach, in which the diffusion of innovations between cities captures transformation processes (mutations) and transmission processes (diffusion), using two coupled spatial interaction models. Explorations of the model on synthetic systems of cities show the role of spatial interaction and innovation diffusion ranges on measures of diversity and utility, and the existence of intermediate interaction ranges yielding an optimal utility. Multi-objective optimization shows how the model produces a compromise between utility and diversity.

The last part of the presentation focuses on the concept of co-evolution in urban systems, proposing a specific definition, a method to characterize it based on circular causations, and an application to the co-evolution between transportation networks and territories. For this particular case, we summarise results from co-evolution models at the mesoscopic scale (co-evolution between urban form and road networks) and at the macroscopic scale (co-evolution between cities and urban networks). We finally discuss perspectives towards more complex and multi-scalar models of urban evolution.

Seminar with Abid Mehmood

In the first of this year’s seminar series, we were delighted to host Abid Mehmood, from Cardiff University.

Dr. Mehmood’s paper, “On the history and potentials of evolutionary metaphors in urban planning” provides important insight into various ways in which urban thinkers have incorporated evolutionary images into their conceptualizations of cities. This paper has informed our own theorizing in Parts III, and III of “Towards a Model of Urban Evolution.” 

For our seminar, Dr. Mehmood presented his paper on nature-inspired approaches to urban planning. Here is the abstract:

“Considering cities as complex adaptive systems, the talk will critically examine the (re)emergence of nature-inspired trends in urban planning and design as a way of exploring new relationships between people and places. Although the use of metaphors is not new when describing the state of a city, the recent turn is more concerned with achieving optimal efficiency and overall sustainability of the built environment through observations and experiences from nature. I would further argue that such approaches should aim for integrating citizens’ needs, inclusion and empowerment for a holistic view to the science of cities.”

Towards a Model of Urban Evolution Part I

line

Building a formal model of urban evolution

“Towards a model of urban evolution” is a series of papers that seeks to articulate a formal model of urban evolution. Part I provides context and background for the effort, situating it against related work across multiple fields and arguing that the evolutionary approach has the potential so synthesize them. Part II lays out the core terms and functions of the model. Part III shows how the model can be used to characterize urban evolution in terms of variation, selection, and retention. 

The latest version of Part I was recently published on SocArXiv and can be accessed here. Below is the abstract.

Abstract: This paper seeks to develop the core concepts of a model of urban evolution. It proceeds in four major sections. First we review prior adumbrations of an evolutionary model in urban theory, not-ing their potential and their limitations. Second, we turn to the general sociocultural evolution litera-ture to draw inspiration for a fresh and more complete application of evolutionary theory to the study of urban life. Third, building upon this background, we outline the main elements of our proposed model, with special attention to elaborating the value of its key conceptual innovation, the “formeme.” Last, we conclude with a discussion of what types of research commitments the overall approach does or does not imply, and point toward the more formal elaboration of the model that we undertake in “Towards a Model of Urban Evolution II” and “Towards a Model of Urban Evo-lution III.”

New paper published!: Classification and Regression via Integer Optimization for Neighborhood Change

line

Mapping the evolution of cities

A challenging part of developing evolutionary models of cities is their dynamism. We must find ways to treat change rather than static states as our topic of interest. That is, we often want to understand what something is by how it becomes. Two neighbourhoods might be very similar in terms of their characteristics right now, but have very different propensities to change. Likewise, two neighbourhoods might be quite different at the present moment, but change in similar ways. However, standard methods have a hard time identifying these sorts of similarities grounded in shared propensities to change in response to varying conditions. 

Classification and Regression via Integer Optimization for Neighborhood Change” proposes a new method designed to do just that, through a method we term “predictive clustering.” As the paper notes, the predictive clustering approach makes three key contributions to neighbourhood change research more broadly:

• Conceptually, predictive clustering is highly distinct from traditional methods—in particu-lar, LR. Because it relies on a predictive model, it can uncover how specific characteristics influence an outcome researchers are interested in studying. We can then observe heteroge-neity in those influences and use it to cluster observations. This perspective makes neigh-borhood dynamics fundamental to the definition of urban space.

• Methodologically, in contrast to traditional neighborhood classifications, predictive cluster-ing is based on a specific outcome to which areas similarly “respond.” In other words, our proposal can be considered model-based clustering (Fraley and Raftery 2002). This frame-work defines the current state of a neighborhood as a set of variables thought to influence trajectories of change. In this article, following a long tradition of research, we use income change to illustrate the potential of this methodological feature of our approach (for a recent example, see Hochstenbach and Van Gent 2015).

• Practically, predictive clustering has clear implications that differentiate it from the tradi-tional K-Means approach. Our approach can identify neighborhoods that exhibit different processes of change even if they look similar at any given point in time, and similar dynam-ics even when they look different. Not only is this potentially useful for urban policymakers when designing interventions, it cannot be readily examined when one only considers char-acteristics of the neighborhood, as in the traditional K-Means approach.

Below is the abstract, and here is a link to the paper. 

Abstract: 

This article applies a method we term “predictive clustering” to cluster neighborhoods. Much of the literature in this direction is based on groupings built using intrinsic characteristics of each observation. Our approach departs from this framework by delineating clusters based on how the neighborhood’s features respond to a particular outcome of interest (e.g., income change). To do so, we leverage a classification and regression via integer optimization (CRIO) method that groups neighborhoods according to their predictive characteristics and consistently outperforms traditional clustering methods along several metrics. The CRIO methodology contributes a novel methodological and conceptual capability to the literature on neighborhood dynamics that can provide useful insights for policymaking.

New paper published: Neighbourhood Dynamics with Unharmonized Longitudinal Data

line

Mapping the evolution of cities

Measuring the evolution of cities is challenging. In particular, definitions of spatial units change over time.  The standard methodology is to create standardized definitions and interpolate data across years to the same boundaries. A recently published UGP paper proposes a new methodology for studying long-term neighbourhood change that avoids certain pitfalls of this standard approach by completely avoiding the need to harmonize geographies. 

In addition, the paper utilizes a novel interactive visualization tool to present results and provide researchers with opportunities to explore the data further, across some 40 US and Canadian cities. 

The paper is published in Geographical Analysis, and can be found here. Here is the abstract:

This article proposes a novel method for data‐driven identification of spatiotemporal homogeneous regions and their dynamics, enabling the exploration of their composition and extents. Using a simple network representation, the method enables temporal regionalization without the need for geographical harmonization. To allow for a transparent corroboration of our method, we use it as a basis for an interactive and intuitive interface for the progressive exploration of the results. The interface guides the user through the original data, enabling both experts and nonexperts to characterize broad patterns of stability and change and identify detailed local processes. The proposed methodology is suitable for any region‐based data, and we validate our method with illustrative scenarios from Chicago and Toronto, with results that match the established literature. The system is publicly available, with demographic data for over forty regions in the USA and Canada between 1970 and 2010.

« Older posts Newer posts »